Most of the energy that drives glacier melting comes directly from sunlight, with the amount of melting critically dependent on the amount of solar energy absorbed compared to that reflected back into the atmosphere. The amount of solar energy that is reflected by a surface without being absorbed is called the albedo. A low albedo surface absorbs more of the energy that hits it compared to a high ...[Read More]
Image of the Week – Bioalbedo: algae darken the Greenland Ice Sheet
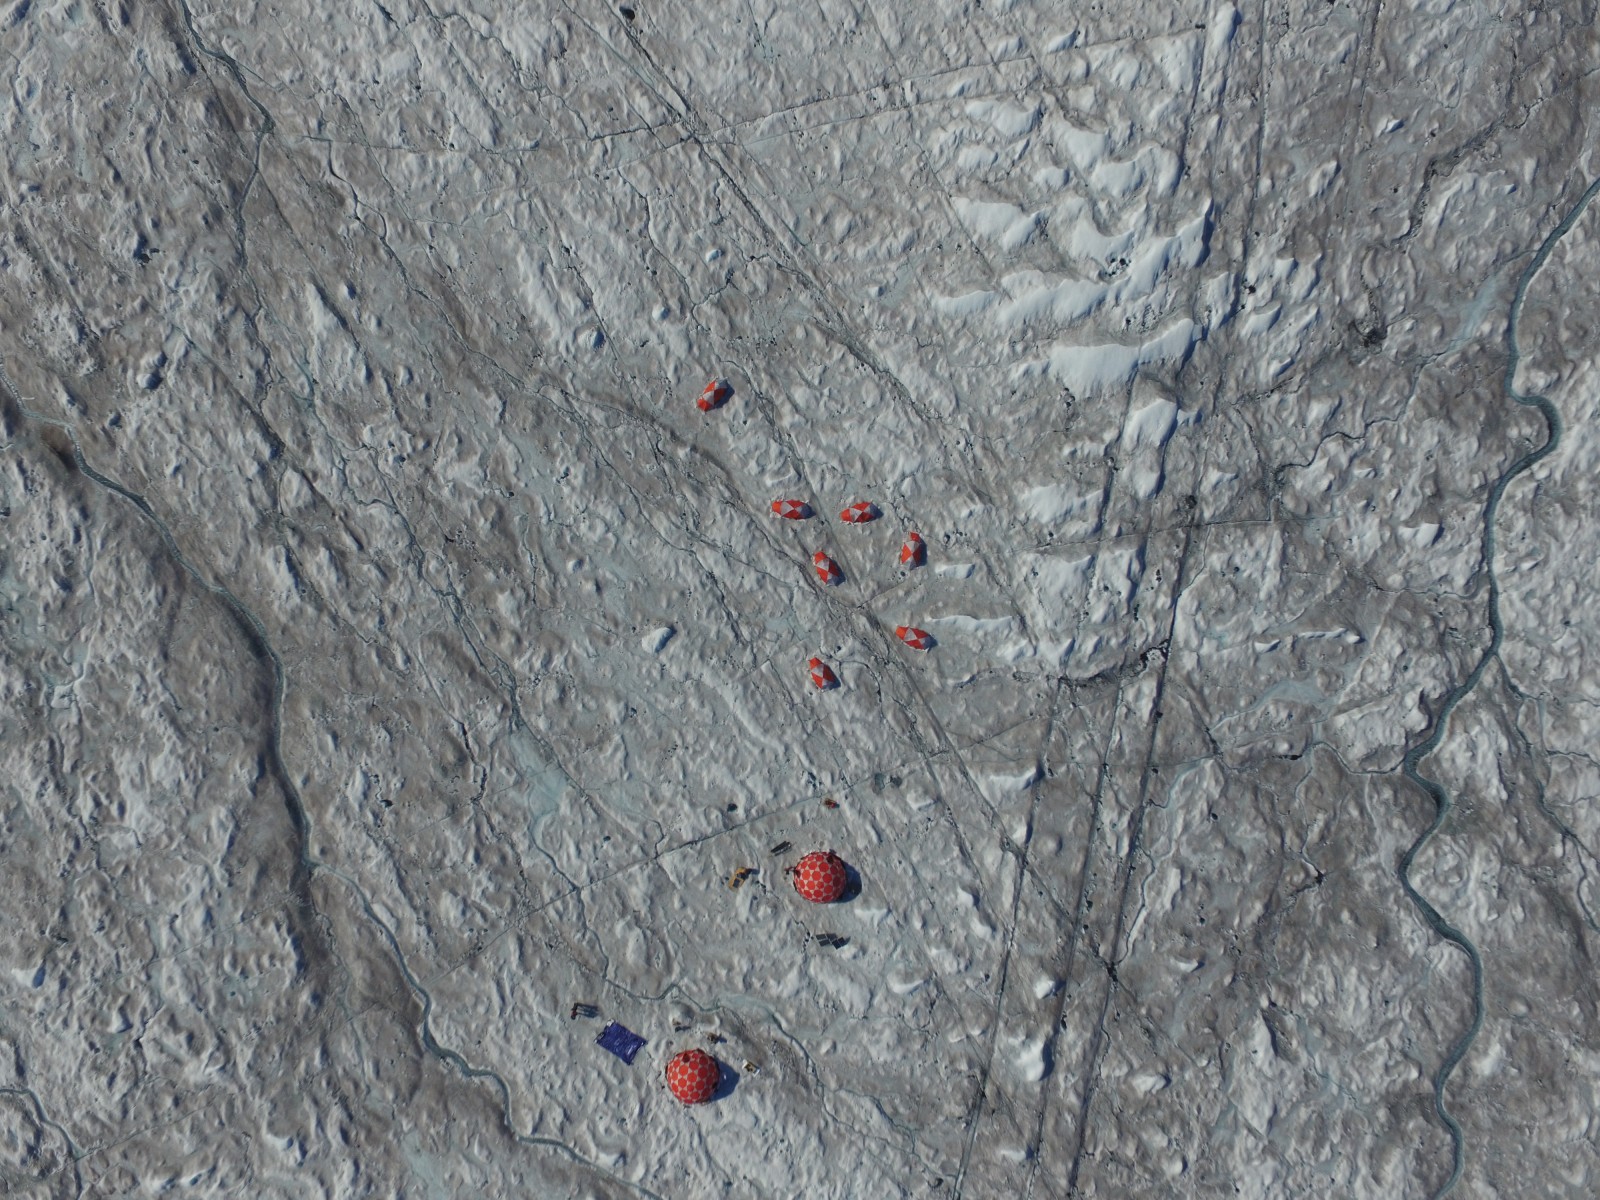
Fig 1: This aerial image shows the surprisingly dark grey-brown colour of the Greenland Ice Sheet surface, around the ‘Black and Bloom’ camp. [Credit: 'Black and Bloom']