The use of drones or Unmanned Aerial Vehicles (UAVs) is one of the most exciting development in glaciology in recent years. The picture was taken during fieldwork conducted in the summer of 2014 by Johnny Ryan and colleague Nick Toberg. The aim was to survey Store Glacier once a day using a fixed-wing UAV, that was equipped with a digital camera, which took photos every two seconds during its dang ...[Read More]
Image of the Week: Greenland Glacier Seen from a Drone
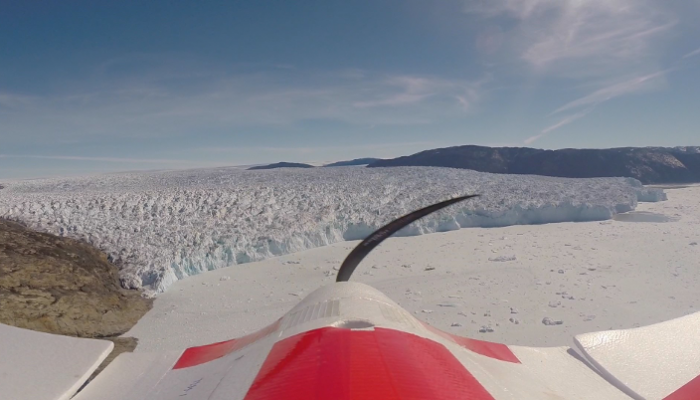
UAV on its way back from a mission with Store Glacier, West Greenland, in the background. Credit: Johnny Ryan