The first time I stood on sea ice, I could not tell which direction the coast was. A community member named Bryan could. That gap in situational awareness, between what a trained remote sensing scientist could read from the landscape and what a local hunter understood instinctively, turned out to mirror almost exactly the gap in our satellite data: ICESat-2 produces reliable freeboard across the central Arctic but goes systematically blind within 25 km of every coastline. This post traces that coastal data gap from its algorithmic roots through its ecological and human consequences, and asks what it would mean to build satellite products that close it on the terms of the communities who need them most.
_____________________________________________________________________________________________________________________________________
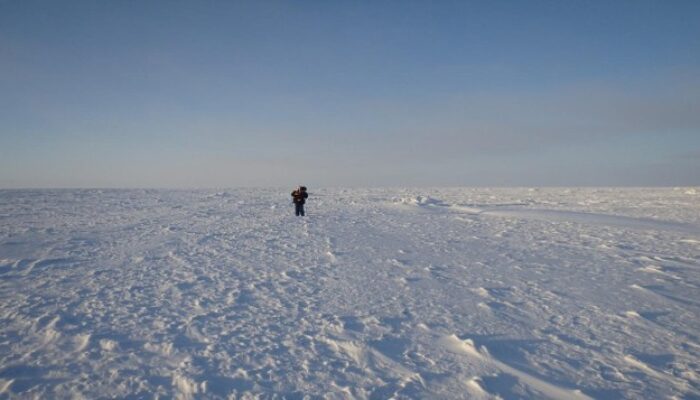
I grew up in Bangladesh, a country defined by delta and monsoon, emphatically not by ice. So when I stepped onto the frozen surface of Hudson Bay near Churchill, Manitoba in December 2021, on my first Arctic field campaign, I was meeting sea ice for the first time outside of a textbook (Figure 1).
I didn’t really understand what it meant to travel over sea ice until I was on the back of a skidoo driven by a community member named Bryan. It was early in the freeze up season, what locals sometimes call the “free up” season, in acknowledgement of how volatile the margins can be. At one point, standing on the ice, I could not tell which direction the coast lay. Bryan simply followed the faint lines left by other skidoos, navigational knowledge encoded in the landscape itself, invisible to me but perfectly legible to him. A short while later, hunters returning from the landfast ice edge warned us we were closer to it than we had realised. Almost on cue, a crack began to open in the surface nearby. Bryan turned us around.
In that moment, the abstract vocabulary of my remote sensing work, freeboard, sea surface reference, landfast ice extent, collapsed into something urgent. Bryan needed to know how thick that ice was. The hunters needed to know whether the edge was stable. These are not research questions. They are safety questions.
Satellites That Couldn’t See Near the Coast
The campaign was meant to be a satellite validation exercise: coincident snow depth and ice thickness measurements supporting ICESat-2 and CryoSat-2 freeboard retrievals during my MSc at the University of Manitoba (freeboard is the part of the sea ice above the waterline). But after we collected the data, we discovered that ICESat-2 had produced almost no usable freeboard within the 25 km coastal buffer around our study area. The multiyear record showed the same pattern season after season: a persistent coastal blank (Figure 2). The satellite had been overhead and had properly collected photons. But the downstream algorithms could not establish a reliable sea surface reference, and the data were flagged or discarded before any calculation for freeboard was attempted. That distinction matters, because it tells us where the solution lies: not in the hardware, but in what we do with the signal (Kwok et al, 2019, Petty et al., 2020). If ICESat-2 could not deliver freeboard within 25 km of the coast, we had to go to get the data. The following year our team at Maryland and the University of Calgary chartered a helicopter to Cambridge Bay, Nunavut (Figure 3 shows the sites that were surveyed). Cambridge Bay is, in many ways, the textbook setting for the failure modes I had identified in Hudson Bay: narrow channels with strong tidal forcing, persistent landfast ice well into spring, heavily ridged shore fast ice, and the operational stakes of sitting on the Northwest Passage shipping corridor (Smith et al., 2013). All algorithmic problems described in the following occur here simultaneously. That image of clean central Arctic freeboard ringed by a stubborn coastal void became the puzzle driving my MSc thesis and now my PhD at the University of Maryland.
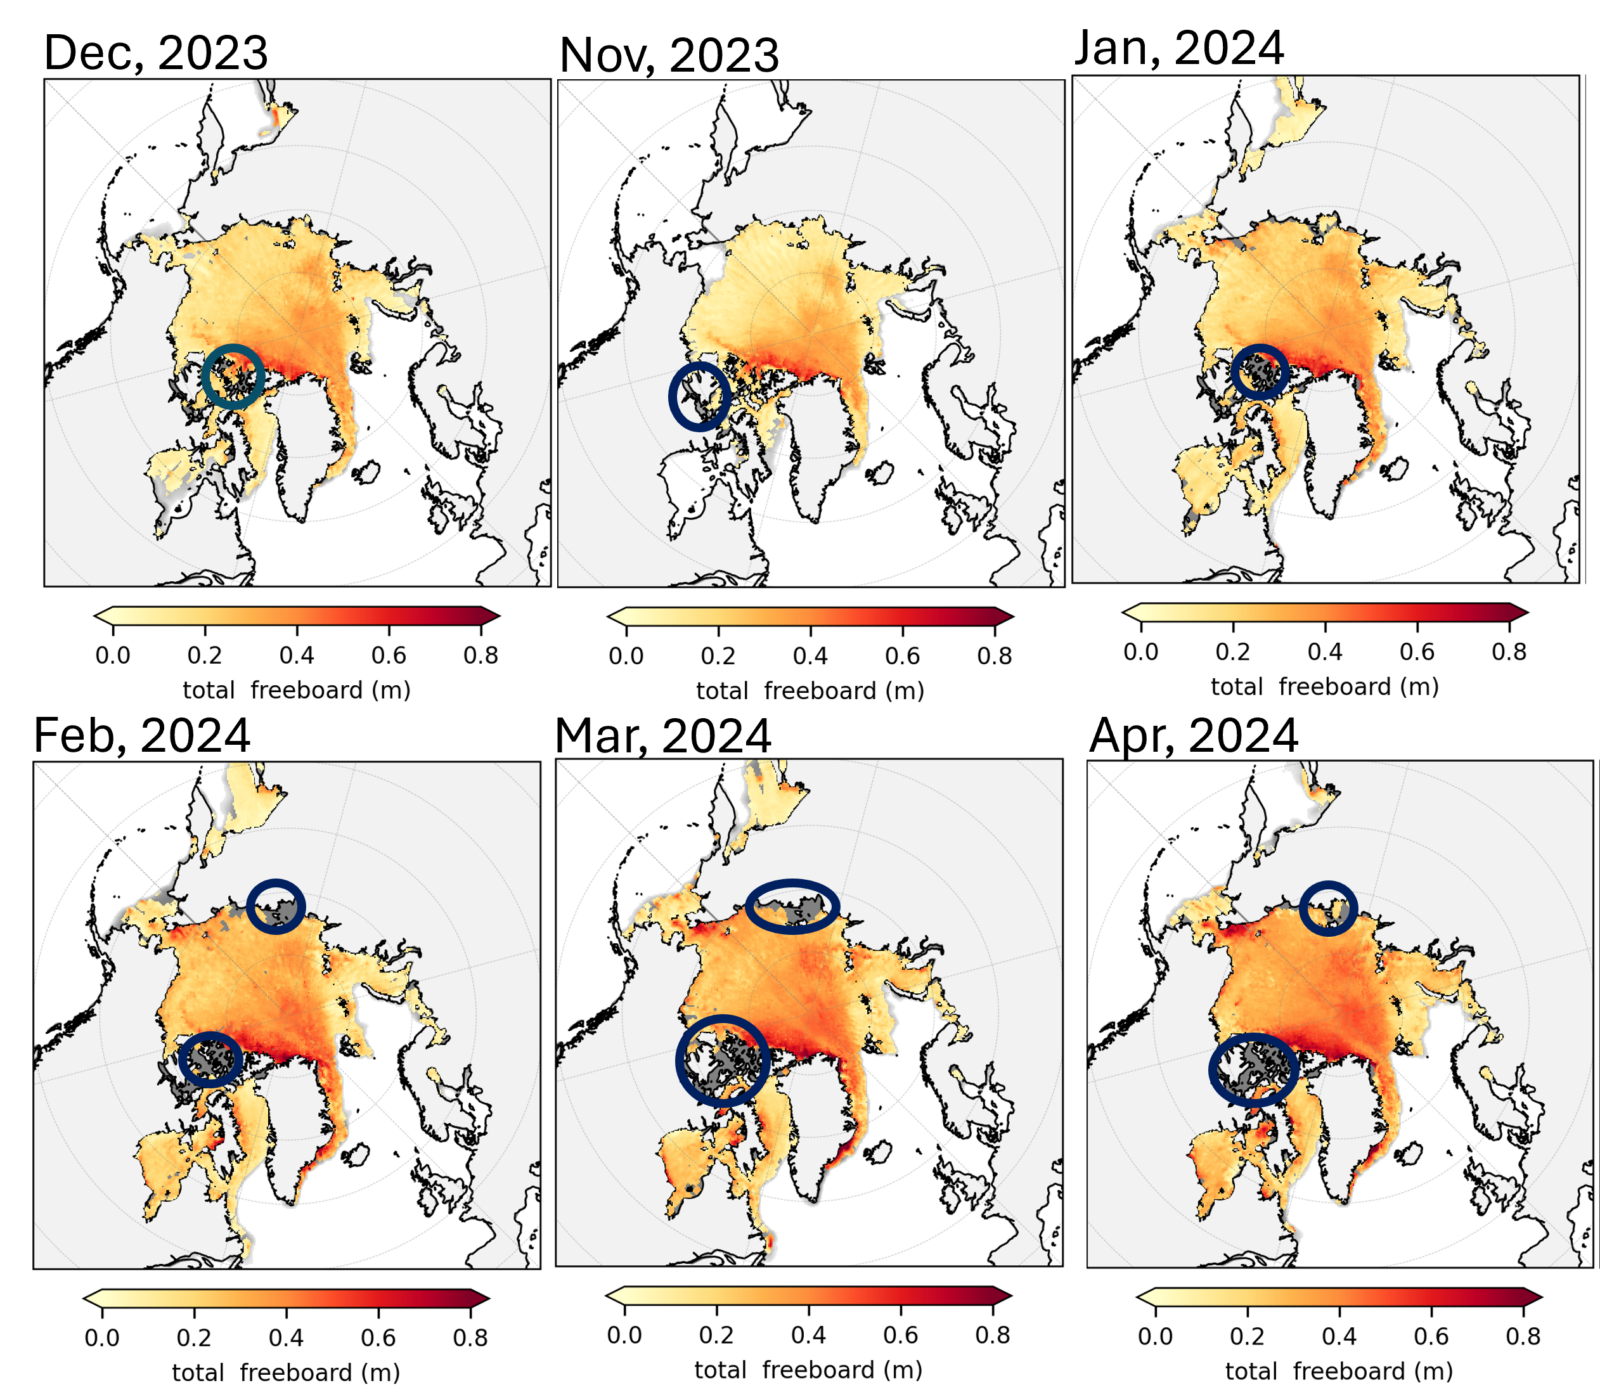
Figure 2. Monthly ICESat-2 ATL10 total freeboard, November 2023 to April 2024. The dark blue ring indicates the near coastal data gap that persists through the full winter growth season. [Credit: Monojit Saha]
How Altimeters Measure Ice
A sea ice floe sits in seawater like an ice cube in a glass with the freeboard as the portion above the waterline. Given an independent estimate of snow depth and the densities of snow, ice, and seawater, freeboard converts to total thickness through hydrostatic balance.
The two altimeters at the heart of this work see the floe differently. ICESat-2’s ATLAS photon counting lidar reflects from the air to snow interface and therefore measures total freeboard (snow plus ice above sea level). CryoSat-2’s Ku band radar is conventionally assumed to penetrate the dry snow column and reflect from the snow to ice interface, yielding ice freeboard, although the validity of that assumption is now under active scrutiny (Nandan et al., 2017). The difference between the two retrievals along nearly coincident ICESat-2 and Cryosat-2 orbits provides the basis for satellite snow depth on sea ice. It is also the reason coastal data loss is doubly costly: when the algorithms fail, we lose both freeboard and the dual altimeter snow depth product simultaneously.
The hard part for either sensor is the reference. We need an accurate, instantaneous sea surface height beneath the satellite, which in practice means finding open water or thin ice leads (sea ice leads are long cracks formed when Arctic ice floes diverge or shear), measuring their elevation, and differencing it from the surrounding ice. In the central pack, where leads are abundant and geometrically clean, this works well (Kwok et al., 2015). However, near the coast the scarcity of open water leads in the landfast ice along with challenges poised by algorithmic limitations linked to interactions of lidar with the rugged landfast ice makes the traditional method of measuring freeboard and ice thickness difficult. ICESat-2’s lead classifier, built on a narrow set of photon descriptors, misreads the coastal lead population: refrozen and wind roughened leads are misclassified as ice and bias the sea surface reference upward, while dark leads are indistinguishable from low albedo thin ice and excluded by default (Petty et al., 2021, Liu et al., 2025). On top of this, the embedded global tide models carry large errors in shallow bays, fjords, and inter island channels, leaving residual biases sufficient to drive thin first year ice freeboard into physically implausible negative values (Saha et al., 2025, Stammer et al., 2014).
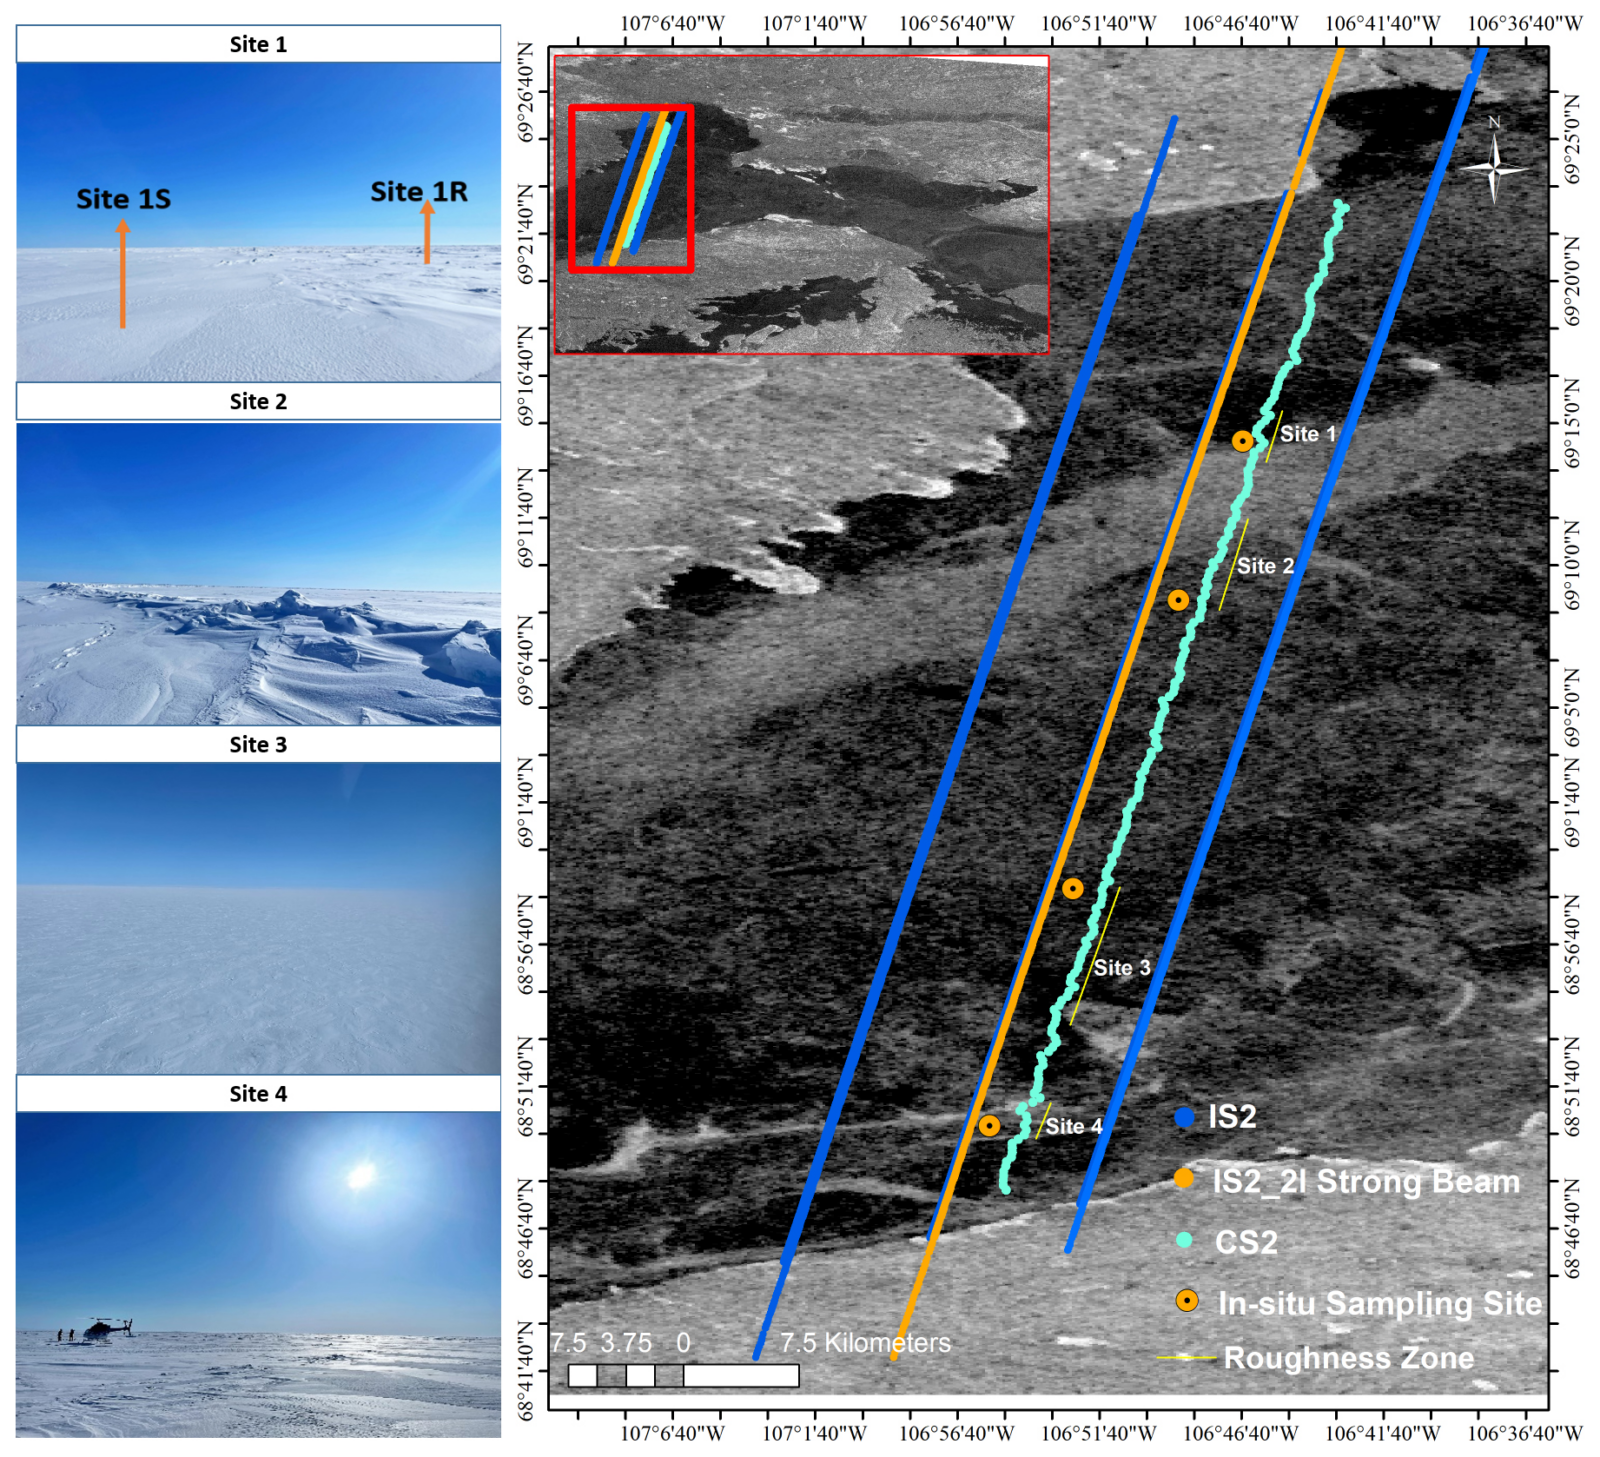
Figure 3. Study sites at Cambridge Bay that were surveyed to understand the near-coastal ice along the Dease Strait [Credit: Saha et al., 2025]
Rescuing the Coastal Record
This diagnosis points directly at where the rescue effort has to happen: the surface classifier. A growing body of work, including custom and machine learning classifiers operating on ICESat-2 photon clouds, has demonstrated that a meaningful fraction of voided coastal segments contains physically valid specular returns that the operational classifier discards as ‘dark’ leads (Liu et al., 2025).
As part of my ongoing PhD research at the University of Maryland College Park, I’m working towards developing algorithmic improvements to the current fixed threshold based algorithm on ICEsat-2 to a deep learning based workflow for sea ice surface classification. The improvement also tries to address the dark lead misclassification issue and leads to rescue of leads that were labelled as “dark” by the algorithm and therefore not considered for subsequent freeboard measurements from ICESat-2.
From Satellite Design to Community Design
The Arctic’s coastal blind spot reflects genuine physical complexity at one of the hardest remote sensing environments on Earth, compounded by algorithms calibrated for the central pack and ancillary inputs (passive microwave sea ice thickness, global tide models) that degrade near the coast. The diagnosis is now clear, and filling the spatial gap is tractable with designing coastal specific classifiers, using multi sensor integration with NASA’s Surface Water and Ocean Topography (SWOT)/ NASA-ISRO Synthetic Aperture Radar (NISAR), and conducting validation campaigns around the near coastal zone.
However, the near coastal zone is not just a remote scientific abstraction. It is the most socially and ecologically consequential strip of ice in the Arctic. Landfast ice is the platform from which Indigenous communities hunt, travel, and sustain cultural practices with millennial roots (Huntington et al., 2016). Across northern Alaska the landfast season has shortened markedly since the late 1990s, compressing the spring bearded seal hunting window and leaving no easy food system substitute (Mahoney & Einhorn., 2026, Druckenmiller et al., 2013). The landfast ice edge and adjacent coastal polynyas are also among the most biologically productive features in the polar ocean. They drive spring blooms and support ringed seal pups whose survival depends on snow loaded ice lairs (Stirling, 1997), an ecological dependency directly tied to the snow on sea ice product that coastal altimetry could deliver if the data gap were closed. A satellite freeboard product that systematically voids data across this zone is not a technical inconvenience. It is a missing observational record at exactly the place where human safety, Indigenous food security, coastal stability, and marine ecosystem dynamics converge.
And exactly this social and ecological importance of the near coastal zone caused me to wonder what it would look like to build satellite data products around community need rather than asking communities to adapt to what satellites already produce. It would mean going to Churchill and Cambridge Bay not just to validate algorithms but to ask what information is actually missing, at what time of season, at what spatial resolution, and in what format it would be usable. It would mean near-real-time dissemination pipelines as a design requirement, not an afterthought. It would mean feedback loops where local observers, hunters, and rangers contribute ground truth that shapes not only algorithm validation but the variables the product prioritises in the first place. The technology to do much of this exists. What has been missing is the willingness to treat community knowledge as a design input rather than a communication challenge. Bryan knew the ice better than the satellite did. The right question is not how we explain our data to him, but how we build systems that learn from what he already knows.
References
- Kwok et al., 2019: ATLAS/ICESat-2 L3A Sea Ice Freeboard, Version 1
- Petty et al., 2020: Winter Arctic Sea Ice Thickness From ICESat-2 Freeboards
- Smith et al., 2013: New Trans-Arctic shipping routes navigable by midcentury
- Nandan et al., 2017: Effect of Snow Salinity on CryoSat-2 Arctic First-Year Sea Ice Freeboard Measurements
- Kwok et al, 2015: Variability of Arctic sea ice thickness and volume from CryoSat-2
- Petty et al., 2021: Assessment of ICESat-2 Sea Ice Surface Classification with Sentinel-2 Imagery: Implications for Freeboard and New Estimates of Lead and Floe Geometry
- Liu et al, 2025: Enhanced sea ice classification for ICESat-2 using combined unsupervised and supervised machine learning
- Saha et al., 2025: Snow depth estimation on leadless landfast ice using Cryo2Ice satellite observations
- Stammer et al., 2014: Accuracy assessment of global barotropic ocean tide models
- Huntington et al., 2016: Effects of changing sea ice on marine mammals and subsistence hunters in northern Alaska from traditional knowledge interviews
- Mahoney & Einhorn, 2026: The Evolving Decline of Landfast Sea Ice in Northern Alaska and Adjacent Waters: Results from an Updated Climatology
- Druckenmiller et al., 2013: Trails to the whale: reflections of change and choice on an Iñupiat icescape at Barrow, Alaska
- Stirling, 1997: The importance of polynyas, ice edges, and leads to marine mammals and birds
Edited by Florina Schalamon and Leah Sophie Muhle