Greetings!
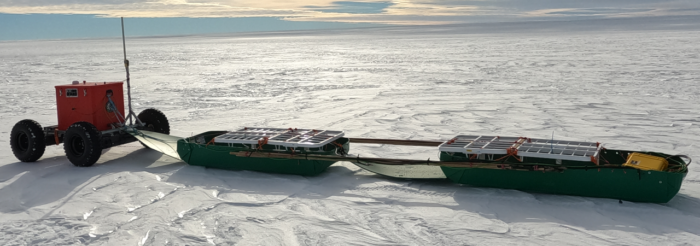
My name is Reza. I’m (still) A PhD candidate in Geophysics and Glaciology at the University of Tübingen in Germany. Today, I will tell you all about a device named pRES, a radar system designed to study ice. Well, pRES and I have had an immense love/hate relationship during the last four years. It is one of the main tools I have used during my PhD, working in the Alps and Antarctica. I even automated the data acquisition process by mounting it on top of a cute red robot which I am so proud of. For me, however, it was not just about collecting data. I spent a huge amount of time processing pRES data, during which I successfully extracted new information related to ice crystals – another proud moment! I also changed how I collect pRES data, because I found the old method complicated and confusing, both in the field and the office. So, working with pRES is now simpler, faster, and more pleasant both in the field and office.
I know it might seem a bit odd to begin an article for a well-known scientific blog like this. Well, it is a trick. I make you feel comfortable, to make you slide into the rest of the article, where things get dark and complicated…just joking. Nothing will be complicated. I wrote the first paragraph to tell you that although pRES and I have been together for many years, I still don’t fully understand this device and its full potential. I decided to write this article in a way that is hopefully understandable! Section one is written for those of you who have never heard the name pRES before and just want to know what it means and what it does. Section two is written to go into a little more details for those keen to know more. In the end, this article mostly targets people who don’t know what pRES is. So, if you are a fancy radar expert, this article might disappoint you.
So long,
Reza Ershadi
Section one: What is pRES?
- A robust, low power consumption ground-based ice-penetrating radar developed by the British Antarctic Survey (BAS) and University College of London (UCL). Its name stands for phase-sensitive Radio Echo Sounder, and it measures ice deformation at a vertical resolution of millimetres.
The two most iconic applications of pRES:
- Super precise basal melt rate detection: pRES is well known for precise basal melt rate detection on ice shelves where two consecutive measurements at the same spot can capture millimetre-sized changes in ice thickness. As you can guess, this is precious information since it is directly related to future sea level rise projections.
- Seeing ice crystals: recently, pRES showed that it had great potential to measure the internal crystalline structure of the ice, such as its anisotropy. This is directly related to how the ice crystals align as a group within the ice column. Obtaining information about the anisotropy of the ice can significantly improve ice flow models and help make them more realistic.
Good! Now you know what pRES is and understand its two important applications.
Section two: Why are radar and ice besties?
A radar emits electromagnetic waves into the ice using a transmitter antenna. In most cases (unless the ice is warm), the radar signal has a low attenuation in ice. This means it penetrates easily through the ice down to several kilometres. The radar signal is sensitive to some essential ice properties: ice temperature, changes in density, conductivity, and ice crystal orientation. This tells us about the geometry of internal ice layers, basal reflectors (boundary between ice and bedrock/ocean) and gives us a peek into processes such as firn compaction (the gradual densification of snow to ice), vertical strain rate, and anisotropy. This makes radar one of the best tools to study ice – but not all radar instruments can do what pRES does!
pRES in a nutshell
You may wonder what is so unique about pRES. Well, there are several reasons! For example, it can operate autonomously. Since it uses very little power, you can turn it on and leave it in a very cold place for a long time to collect time series data. pRES is also not limited to one specific signal frequency. What does that mean? Well, pRES emits a Frequency Modulated Continuous Wave (FMCW) signal. That means instead of a fixed signal frequency; it emits a range of different frequencies starting from 200 MHz up to 400 MHz, with a centre frequency of 300 MHz (i.e., a bandwidth of 200 MHz), where one sweep or sub-bursts (transmitting and receiving 40000 sets of radar signals) takes 1 second. But it’s the phase sensitivity that makes pRES a unique radar, as its name suggests. pRES can record and elegantly process the time shift between the transmitted and received signal phase, making it very precise. This is useful in two ways. Firstly, the orientation of the ice crystals is not only sensitive to the amplitude of the radar signal, but also to the phase. And secondly, the relative phase shift between repeat measurements can detect displacement of in-ice reflectors to a precision on the order of millimetres.
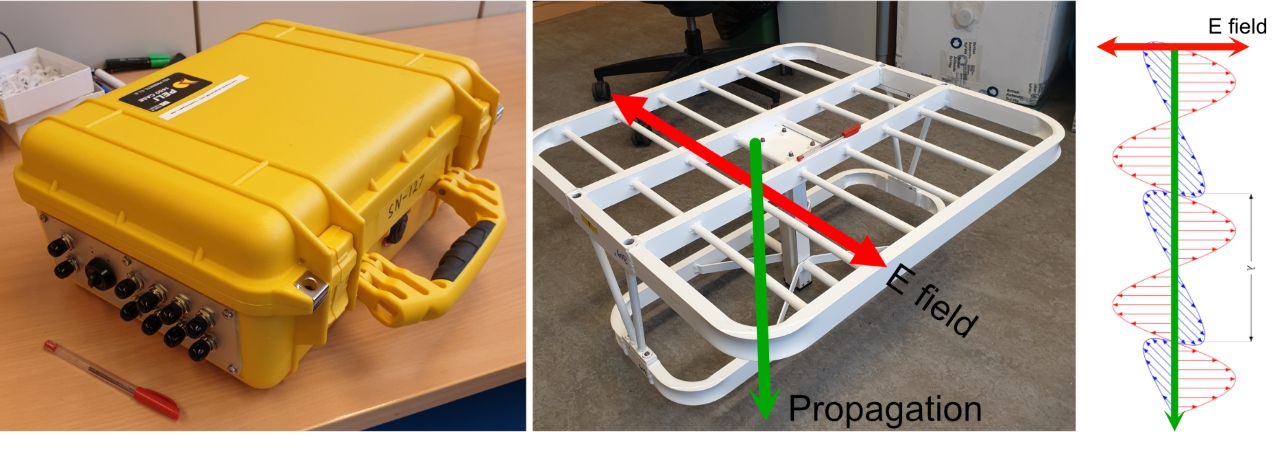
Figure 2. Left: pRES with eight channels. Middle: Slot antenna with red arrow showing the direction of the E field and green arrow showing the direction of wave propagation. Right: Linearly polarized electromagnetic wave with blue as magnetic field and red and green same as before. Figure credit: Reza Ershadi.
To transmit and receive the FMCW signals, pRES uses two Ultra High Frequency (UHF) dipole slot antennae (you see the slot antenna on Figure 2 above). One as a transmitter (Tr) and one as a receiver (Re). The radar electromagnetic waves transmitted from the antenna propagate downward into the ice (green arrows in Fig.2) with a linear polarization, where the direction of the polarization is the direction of the electric field (E field) and parallel to the surface (red arrows in Fig. 2). Therefore, the orientation of the Tr and Re antennae relative to each other is important. Since pRES emits the radar signal vertically downward, the antenna’s orientation is defined as the direction of the E field on a horizontal plane (red arrows in Fig. 2). You can have the Tr and Re antennas oriented in a Co-Polarized way (E field in Tr and Re are aligned) or in a Cross-Polarized way (E field in Tr is 90 degrees off from Re). I like to name the E field orientation in the antenna based on their cable direction, simply calling it Left (L), Right (R), Up (U) and Down (D) relative to the position of the operator. This is what I came up with after four years of working with this radar; and believe me, this will make your life much easier for processing the data. It is always recommended to write down the azimuth of the line which connects the two antennas relative to the geographic North so you can geo-reference it later.
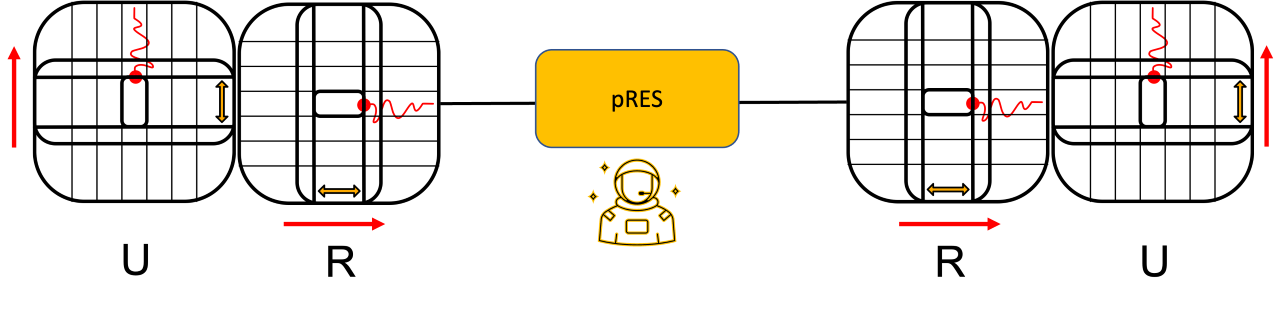
Figure 3. Schematic of Quad-Polarimetric setup with “easy” naming for the antennas based on the direction of the E field and the cable connection on each antenna. Figure credit: Reza Ershadi.
pRES in the field
Here are some essential things that you might want to know if you are planning to collect pRES data for yourself or someone in the field. First, you need to conduct some test runs. You should optimize some of the parameters in the pRES system to get the best possible signal. The best choice of parameters, including gain, attenuator, and the number of sub-bursts, depends on what kind of ice is beneath you. Gain and attenuator are two parameters to ensure that a sufficiently strong signal is being recorded, without overloading any of the circuitry. Increasing the number of sub-bursts means how many times pRES should repeat the exact same measurement (each sub-burst takes 1 second), which is a technique to increase the signal to noise ratio. You should never collect pRES data with less than 5 sub-bursts (try to stay above 20 sub-bursts). The advantage is that the radar is designed so that you can optimize everything in less than 2 minutes, and you are ready to collect! Depending on the purpose of your study, there are two main ways to collect pRES data: ApRES and Quad-Polarimetric. Don’t forget there are also other methods to collect pRES data, but we are not discussing them here.
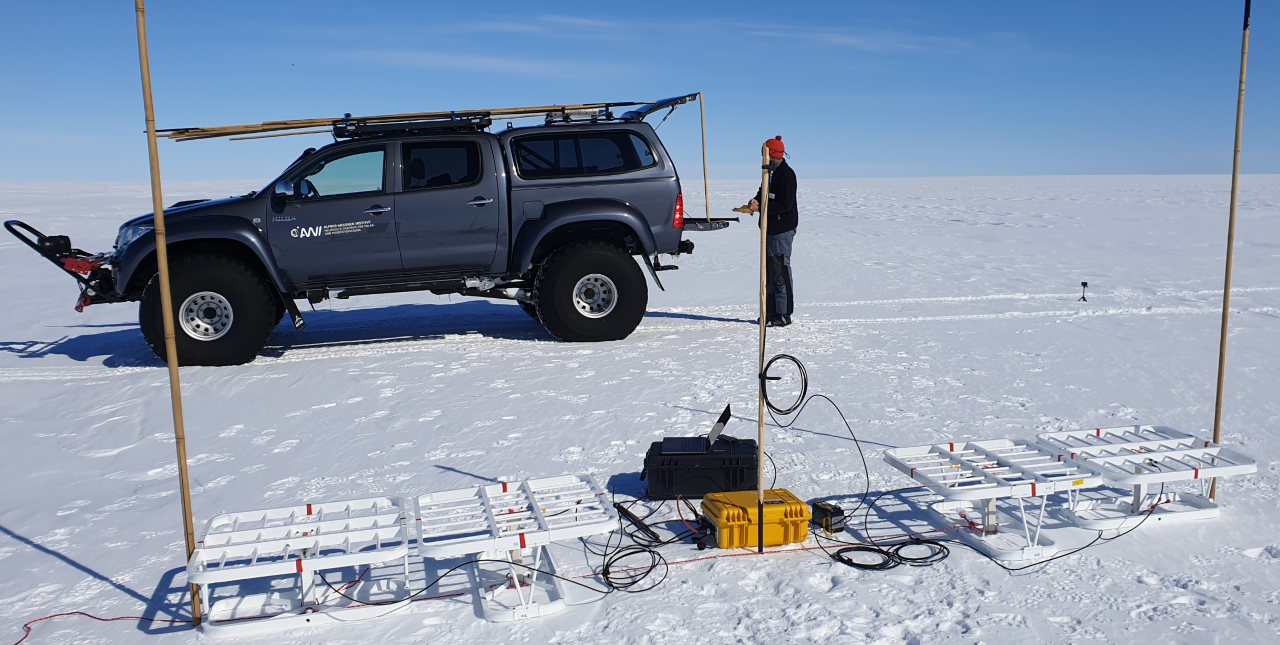
Figure 4. Collecting Quad-Polarimetric pRES data on the Ekström Ice shelf, Antarctica (ReMeltRadar 2021-22). The yellow box in the center is the pRES connected to a computer to manually trigger the measurements. Four antennas are connected to the pRES to collect Quad-Polarimetric data. The two antennae on the left are transmitters (Tr) and the other two on the right are receivers (Re). Photo credit: Reza Ershadi.
ApRES: The most common way to collect pRES data is to leave the pRES with two antennae in a fixed location and let it measure with fixed time steps. Note that it is recommended that the E field in both antennae for this method are aligned in the same direction (Co-Parallel). Since pRES is a low power consumption device, it can collect data continuously for more than a year with a 12 V battery. This method is also known as Autonomous pRES (ApRES). The data collected in this way can be used to study seasonal change, tide fluctuation, vertical strain rate, firn compaction, and basal melt rate. We also recently used this method to learn if the ice crystal fabric changes over one year (stay tuned, we will find out this winter 2022/23!).
Quad-Polarimetric: If you plan to study the ice crystal fabric, including the anisotropy of the ice column, you need to collect pRES data in four different antenna combinations. You can do it the complex way or the simple way. Here is how you do it in the simple way. pRES is a multi-channel radar, which means you can connect several Tr and Re antennae simultaneously. This allows you to collect pRES data in co- and cross-polarized in one go. To do that, you need two Tr antennas that are 90 degrees off from each other (e.g., R and U) and two Re antennas again at 90 degrees to each other (exactly what you see in Fig. 4). With this, you can collect four data combinations: UU and RR as co-polarized and UR and RU as cross-polarized. We call this type of data acquisition Quad-polarimetric. The advantage here is that you collect all the data in one go and can then use a rotation transformation to synthesize any antenna combination for any orientation. You can probably guess what the complex way is. You collect every antenna combination for every 10 or 15 degrees by manually rotating the whole system which, takes more time, and there is plenty of space for human error when you turn the antenna.
pRES in the office
No! Definitely not! I will not open Pandora’s box and explain here how to process pRES data. However, you are always welcome to contact me and below I also link some top-class publications about pRES in case you wanted to read more. But make sure you get enough coffee before you start 😉
Well, that is it. Everything I can say about pRES in 2000 simple words. Thanks for reading the whole article. I hope you enjoyed it!
Further (fun!) reading:
- Corr et al. 2002 (Precise measurement of changes in ice-shelf thickness by phase-sensitive radar to determine basal melt rates).
- Gillet-Chaulet et al. 2011 (In-situ quantification of ice rheology and direct measurement of the Raymond Effect at Summit, Greenland using a phase-sensitive radar).
- Brennan et al. 2014 (Phase‐sensitive FMCW radar system for high‐precision Antarctic ice shelf profile monitoring).
- Nicholls et al. 2015 (A ground-based radar for measuring vertical strain rates and time-varying basal melt rates in ice sheets and shelves).
- Jordan et al. 2020 (Estimation of ice fabric within Whillans Ice Stream using polarimetric phase-sensitive radar sounding).
- Young et al. 2020 (Rapid and accurate polarimetric radar measurements of ice crystal fabric orientation at the Western Antarctic Ice Sheet (WAIS) Divide deep ice core site).
- Case and Kingslake 2021 (Phase-sensitive radar as a tool for measuring firn compaction).
- Ershadi et al. 2022 (Polarimetric radar reveals the spatial distribution of ice fabric at domes and divides in East Antarctica).
- Rathmann et al. 2022 (On the Limitations of Using Polarimetric Radar Sounding to Infer the Crystal Orientation Fabric of Ice Masses).
- Zeising et al. 2022 (Basal melt of the southern Filchner Ice Shelf, Antarctica).
Edited by Jenny Arthur and Marie Cavitte
 Reza Ershadi is a PhD candidate in Geophysics and Glaciology with an engineering background. His PhD project (funded by the Emmy Noether program) consists of two major topics: studying the internal structure of ice using phase-sensitive radar and developing an ice rover to autonomously collect polarimetric radar data in Antarctica. He has collected pRES data over several Alpine glaciers. He was part of the ReMeltRadar2021-22 project to collect pRES data on the Ekström Ice shelf in Antarctica, which he will continue this year as the group leader of ReMeltRadar2022-23. Sometimes he also tweets as @RezaErshadi6789.
Nick Everard
Excellent blog! Love that it focusses on the measurement technology!
Do you know if these systems have any potential for measuring the properties of liquid water, for example currents and temperatures in rivers and lakes…?