
Looking out over the sea on a quiet day with no wind, the word “flat” would certainly pop up in your mind to describe the sea surface. However, this serene view of a flat sea surface is far from accurate at the global scale.
The apparent simplicity behind the concept of sea level hides more complex science that we hope to explain in a simple manner in today’s “For Dummies” post, which will give you the keys to understand the important aspects of past sea change, and an ability to look into and understand how sea level is a key factor in the future.
Everyone will be familiar with news stories about current sea level rise, but it can be very confusing to understand what this means in real terms; how fast it is happening and why we should care about it anyway. So to begin with, let’s have a look at what we mean by sea level?
Sea Level – It’s all about gravity!
Imagine the Earth as a perfect sphere overlaid with a thin layer of water – the “sea” (Fig. 1). The “sea” does not escape into space due to the gravitational attraction between the Earth and the water mass (see gravity box). If the Earth was a perfect sphere of uniform density, water would be equally distributed across the surface and “sea” level would be equal everywhere. However, as we know, this is not the case!
The “sea” does not escape into space due to the gravitational attraction between the Earth and the water mass
The strength of gravity varies around the globe, for a number of reasons:
- As the Earth rotates on its own axis, it causes the the shape to deform, flattening it at the poles and bulging at the equator. The flattened sphere is called the “ellipsoid” (Fig. 2) . In fact, the distance from the centre of the Earth to the surface ranges from 6,353 km at the poles to 6,384 km at the Equator.
- The Earth is also a “living planet” with areas constantly being created, altered and destroyed – for instance through the movement of Tectonic Plates. This induces tiny differences in both gravity field amplitude and direction at the surface of the Earth. All of which means that the ocean water is attracted to certain parts of the globe more than others! If you feel heavy in Brussels, Belgium, consumption of Belgian beers may not be the only explanation – the gravity in Brussels is about 0.2% stronger than in Havana, Cuba.
![Fig 1: The Earth as a perfect sphere, note that the sea surface is perpendicular to gravity direction. [Credit: L. Favier]](https://blogs.egu.eu/divisions/cr/files/2016/10/sphere.eps_.jpg)
Fig 1: The Earth as a perfect sphere, note that the sea surface is perpendicular to gravity direction. [Credit: L. Favier]
Gravity

The gravity field exerted by a body against another body is proportional to the two masses (but here the mass is mostly the Earth),
inversely proportional to the square of the distance between the two bodies1.

11- The gravitational acceleration g = - G M / r2 with G the gravitational constant, M the mass of the Earth and r the distance to the Earth center.
If you feel heavy in Brussels, Belgium, consumption of Belgian beers may not be the only explanation – the gravity in Brussels is about 0.2% stronger than in Havana, Cuba
The actual shape of the Earth and the oceans
All these small variations in Earth’s gravity affect sea level at the local scale and we can no longer use the simple concept that water is equally distributed across the Earth’s surface. Instead we use the Geoid (Fig. 2 and Fig. 3) to approximate mean sea level – this is an imaginary surface around the Earth on which acceleration due to gravity (the “strength” of the pull of Earth’s gravity) is constant. Such a surface is know as an equipotential (surface of equal gravitational potential) and it corresponds to the sea surface where you have oceans (Fig 2.).
![Fig 2: The Earth ellipsoid and a conceptual Geoid. [Credit: L. Favier]](https://blogs.egu.eu/divisions/cr/files/2016/10/geoid.eps_-2.jpg)
Fig 2: The Earth ellipsoid and a conceptual Geoid. [Credit: L. Favier]
The Geoid has been measured continuously since 2002 by the GRACE satellites – two satellites that orbit Earth following each other at a short distance. Let us try to explain how those two satellites work, using the analogy of their two nicknames: Tom and Jerry:
- Tom is chasing Jerry at an average distance of, say, 1 meter.
- But then Jerry jumps over a chair that is in his way and it slows him down a little and Tom gets a little closer to him.
- However, Tom also has to slow down to jump over this chair and Jerry begins to move away from Tom on the other side.
- By the time they are both over the chair they are again 1 m apart and Tom never manages to catch Jerry!
The two GRACE satellites behave similarly when passing over an area of the Earth with decreased gravitation pull. This area (i.e. the chair) causes the first satellite (Jerry) to slow down and the second one (Tom) catches up. The distance between the two satellites is thus a measure of local gravitational pull and can be used to construct the Geoid surface and thus approximate mean sea level. The result of these slight changes in gravity are shown in Fig. 3. If you have a look at the Himalayan mountain range for example in Fig. 3a, you can see that the Geoid there is higher (in red colour), which means that this part of the Earth exerts a larger than average gravitational pull.
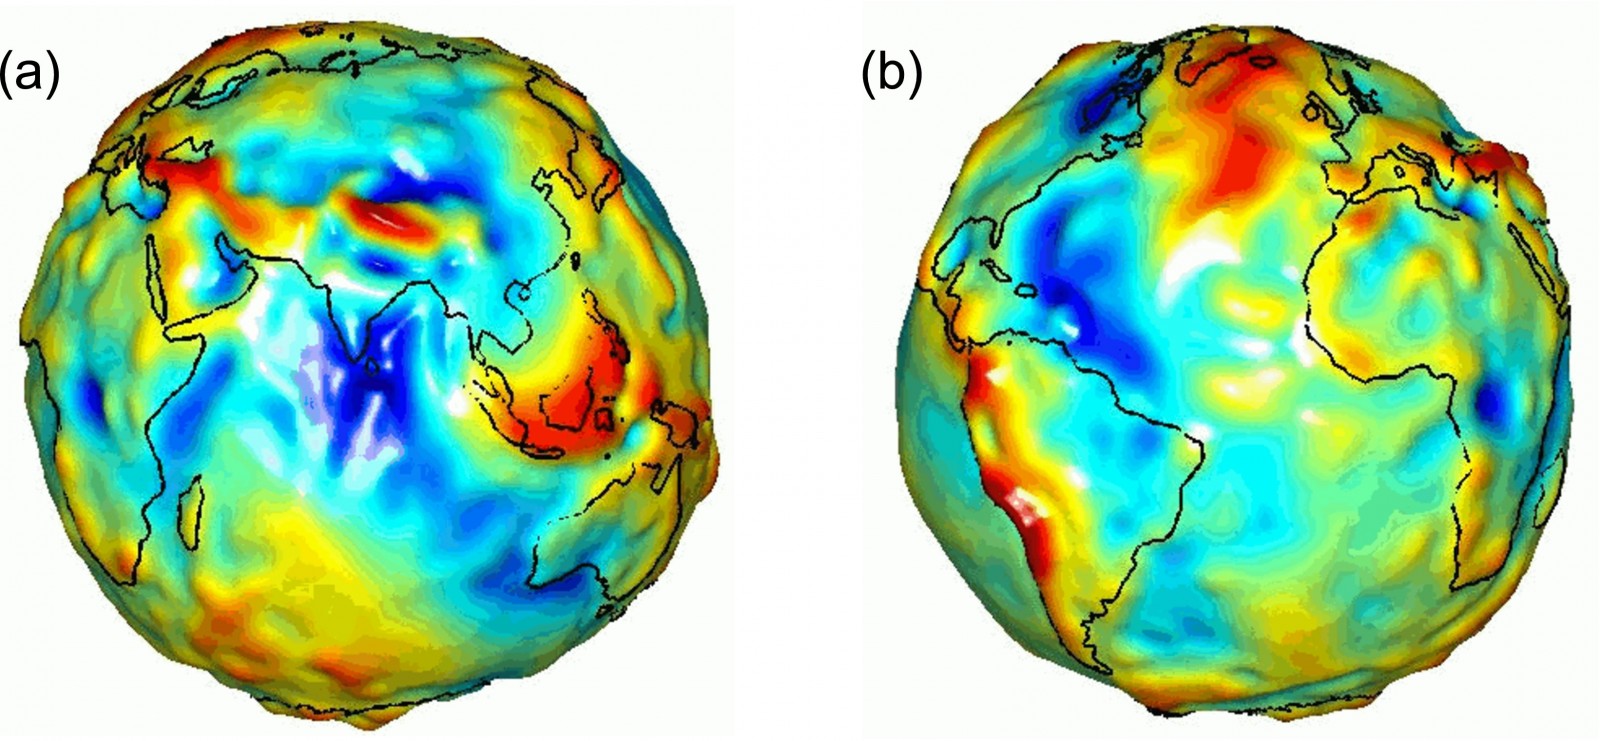
Fig 3: Geoid shape centred in (a) India and (b) the Atlantic Ocean as measured by the NASA satellite GRACE. Red (blue) areas have a gravity higher (lower) than the idealised Earth, i.e. Ellipsoid in Fig. 2.[Credit: NASA]
However, measuring the sea level (Geoid) has not always been made using such advanced techniques. The first sea level records, from around 200 years ago, were made manually and then around 160 years ago using self recording tide gauges. Since 1993, sea level changes have been measured by satellite altimeters and more recently by our GRACE satellites (Tom and Jerry).
What determines local sea level…
- Thermal expansion: heating water causes it to expand and take up a larger volume.
- Water transfer between land, e.g. melting ice poured in the oceans.
- Changes in local gravity field – large land masses (ice included) have a gravitational pull on water, attracting it towards the land and causing a small local increase in sea level.
- There are also other local effects due to winds, tides and oceanic currents, but this is not the subject today.
These factors are not independent, however, so let’s have a look at how the first three factors together contribute to sea level rise, using the change in sea level between 2000-2008 as an example (Fig. 4). We will not discuss local meteorological effects here as it only has a minor affect on the mean sea level.
… a practical example with current climate change!
As global temperature rises in the atmosphere, due to climate change, some of this heat is absorbed by the oceans, which – mostly vertically – expand and rise the sea level (Point 1 above).
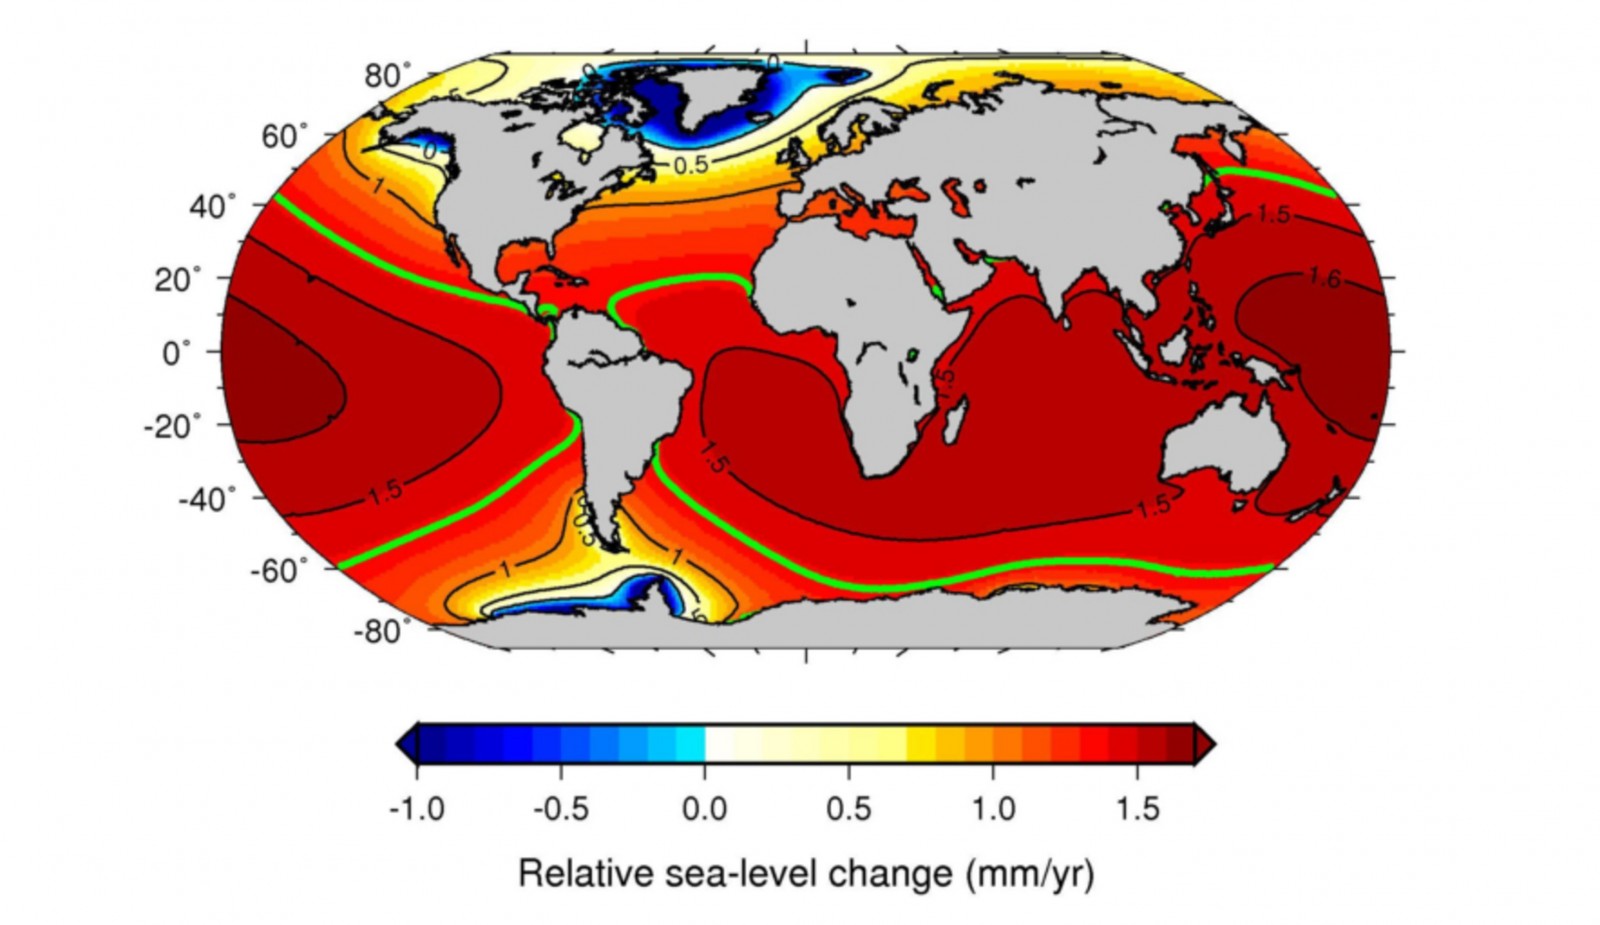
Fig. 4: Effect of the melting land ice masses on the sea level for the period 2000-2008. The green line represents the global average sea-level increase of 1.4 mm/yr. [fig 4 from Bamber and Riva, 2010]
Warming atmosphere and ocean also cause the ice sheets and glaciers to shrink from above and below (when the ice is afloat). For example, the current mass loss of Greenland ice sheet (Fig. 4) has two effects on mean sea level. The most obvious is (i) the increase in sea level by adding more water to the ocean (Point 2). The other is (ii) a decrease in sea level in the vicinity of the melting ice sheet, because as the ice sheet loses mass, it exerts a smaller gravitational attraction to the ocean (Point 3). This is why a blue blob appears around the Greenland ice sheet in Fig. 4, but also around the Peninsula in the Antarctic ice sheet as these areas lost a significant amount of mass between 2000 and 2008.
A shrinking ice sheet increases the global sea level by adding more water to the ocean … but it also decreases the local sea level in its vicinity because the mass loss lower the gravitational attraction on its surrounding sea
Sea Level changes — Past, Present and Future
In the past
As we have seen, direct measurements of sea level range back around 200 years but we can also use indirect measurements to go further back in time. These reconstructions indicate that global mean sea level was about 5-10 m higher during the last interglacial – warm – period (a.k.a Eemian, about 120,000 years ago) than present, under a climate that was at least 2°C warmer. During the Last Glacial Maximum 21,000 years ago, the extent of the Greenland and Antarctic ice sheets, but also the former Laurentide and Fennoscandian ice sheets, were at their maximum, and the sea level was 130 m lower than present. The last deglaciation mainly occurred between 21,000 years and 10,000 years ago, with pulses of melting during which the sea level rose by 4 metres per century. Between 10,000 years ago and the end of pre-industrial, the sea level has barely changed.
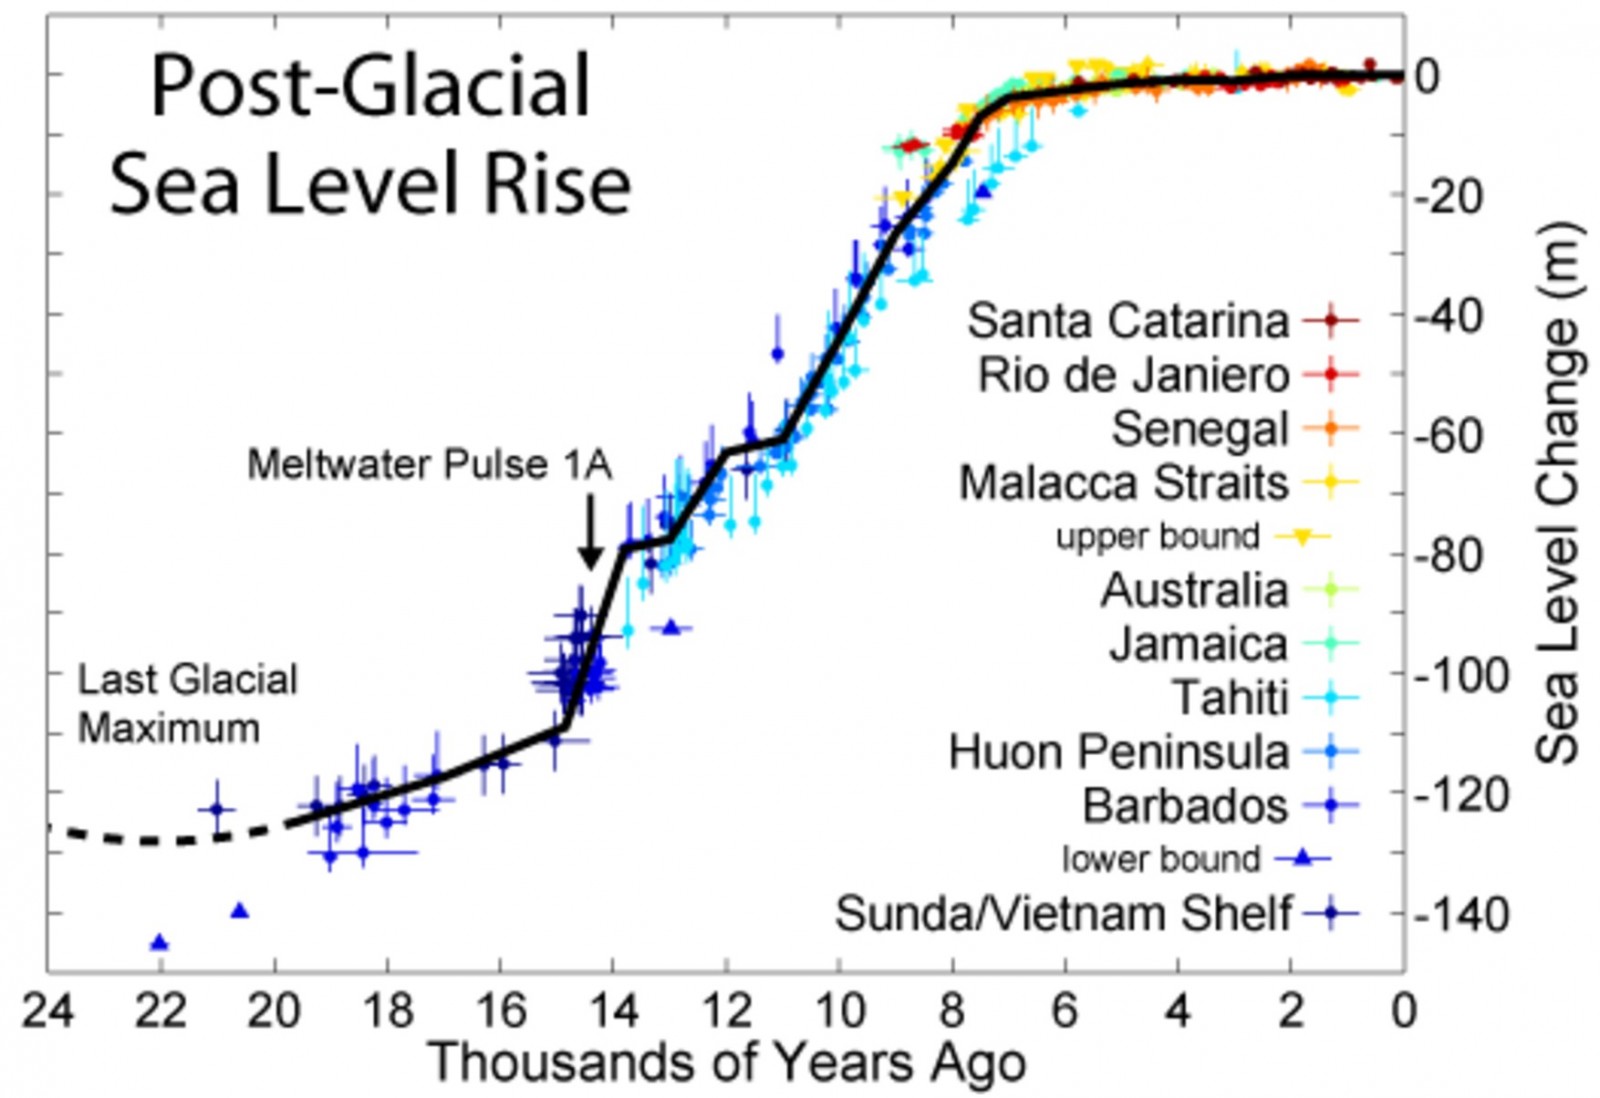
Fig 5: Sea-level variations since the last deglaciation [Credit: R. A. Rhode via Wikimedia Commons].
Since the mid 18th century, the global mean sea level has increased by about 25 cm, and is currently rising at a rate of about 3 mm per year.
Present sea-level changes
Since the mid 18th century, the global mean sea level has increased by about 25 cm (IPCC, 2013), and is currently rising at a rate of about 3 mm per year.
Out of this 3 mm that are added up to sea level each year (Fig. 6):
![Fig 5: Current sea level changes (in the period 1993-2010) from the main contributors [Credit: L. Favier]](https://blogs.egu.eu/divisions/cr/files/2016/10/tubeaessai.eps_.jpg)
Fig 6: Current sea-level changes (in the period 1993-2010) from the main contributors [Credit: L. Favier]
- 1.1 mm come from the thermal expansion of water under warmer temperature.
- 0.86 mm are due to melting of mountain glaciers and ice caps (an ice mass that covers less than 50,000 km2 and being much flatter than mountain glaciers).
- 0.6 mm are added by the melting of Polar ice sheets (0.33 mm from the Greenland ice sheet and 0.27 mm from the Antarctic ice sheet).
In the future
As future sea-level rise can threat coastal settlements around the globe, the influence of a series of future scenarios of temperature evolution for the next century has been investigated by the scientific community. Four different future scenarios have been investigated in the IPCC latest Assessment Report (AR5). Those are based on a wide range of possible changes in future human-made greenhouse gas emissions. The predicted increase in mean sea level range from 40 cm (26 cm to 55 cm) for the “coldest” scenario to 63 cm (45 cm to 82 cm) for the “warmest” scenario.
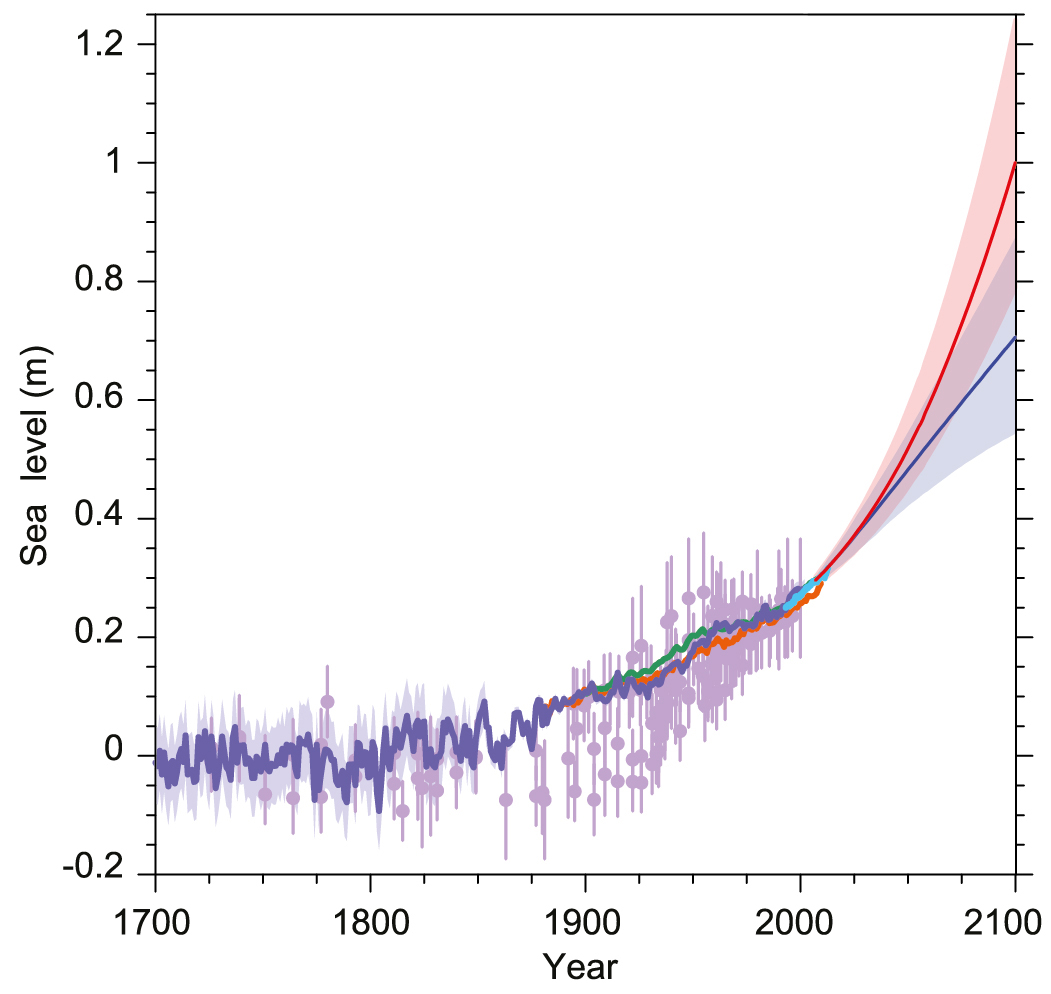
Fig 7. Compilation of palaeo sea level data, tide gauge data, altimeter data (from IPCC (2013), Figure 13.3), and central estimates and likely ranges for projections of global mean sea level rise for RCP2.6 (blue — most optimistic) and RCP8.5 (red — most pessimistic) scenarios, all relative to pre-industrial values. [Fig 13.27 from IPCC (2013)]
References / further reading
- Bamber, J. and Riva, R. (2010). The Cryosphere The sea level fingerprint of recent ice mass fluxes. The Cryosphere, 2008:621–627.
- Church, J A, P U Clark, A Cazenave, J M Gregory, S Jevrejeva, A Levermann, M A Merrifield, et al. (2013). “Sea Level Change.” Chapter. In Climate Change 2013 – The Physical Science Basis, edited by T F Stocker, D Qin, G.-K. Plattner, M Tignor, S K Allen, J Boschung, A Nauels, Y Xia, V Bex, and P M Midgley, 1137–1216. Cambridge, United Kingdom and New York, NY, USA: Cambridge University Press. doi:10.1017/CBO9781107415324.026.
- Prof Jonathan Bamber on changing Antarctic Ice Sheets and rising global sea levels, video on the Antarctic Report
- Reading between the tides: 200 years of measuring global sea level on NOAA Climate.gov
Edited by Emma Smith and Sophie Berger
 Lionel Favier is a post-doctoral researcher of the glaciology unit at the Université libre de Bruxelles (ULB) in Belgium. He is an ice-sheet modeller currently focussing on Dronning Maud Land. He’s now part of the Climate Change Initiative (CCI) project funded by the European Space Agency (ESA), within the Climate Modelling User Group (CMUG).
Pingback: Happy Birthday, GRACE! | Blue Marble Earth
Pingback: Cryospheric Sciences | Image of the Week – Delaying the flood with glacial geoengineering
Pingback: Cryospheric Sciences | Radiocarbon rocks! – How rocks can tell us about the history of an ice sheet…