Do you know how scientists predict and analyse river flows using computer models? In this blog, Juliette Godet explores the tricky task of matching real-world river measurement points to grid cells in these models. Picture a giant digital map of a river basin, divided into grid squares, and a real-life gauge that measures river flow at a specific point. The job is to figure out which grid cell best represents this gauge. Juliette examines traditional methods, introduces a newer approach that promises better accuracy, and discusses the impact of these techniques on understanding and predicting river behaviour. Whether you’re a hydrology enthusiast or just curious about how these models work, this blog post is for you!
If you’ve ever worked with gridded hydrological models, you’ve probably run into this issue: how do you pick the right grid cell to represent your gauging station when calibrating or validating your model?
If you’re new to gridded hydrological models or hydrology in general, think of it this way: a drainage basin is split into grids, where each cell (say, 1km x 1km) has a direction indicating how water flows based on the terrain. Each cell has a certain number of upstream cells, and thus a certain upstream drainage area (UPA). In reality, a hydrometric station is located at a specific point on a river, not on a grid cell. To compare observed and simulated discharge at this station, you need to figure out which grid cell in your model represents this station.
We chose to call this issue the ‘allocation of river points to hydrological modelling grid cells’. It’s a crucial step in gridded hydrology, where we reconnect the ‘model world’, where rivers are represented by pixels, to the ‘real world’, where river networks are accurately known through hydrometric stations, which are represented as point data.
Surprisingly, this problem isn’t well-documented in the literature. The traditional approach involves using distance and upstream drainage area criteria. In this method, you choose the cell closest to the actual gauging station and with an upstream drainage area value closest to the reference size of the drainage basin monitored by the station (see figure 1: this means assigning the green point to cell C8). However, this approach can lead to errors, especially near river confluences where points from different river branches might have similar upstream drainage areas (see figure 1: the green point actually belongs to the right bank tributary and should be assigned to cell C6).
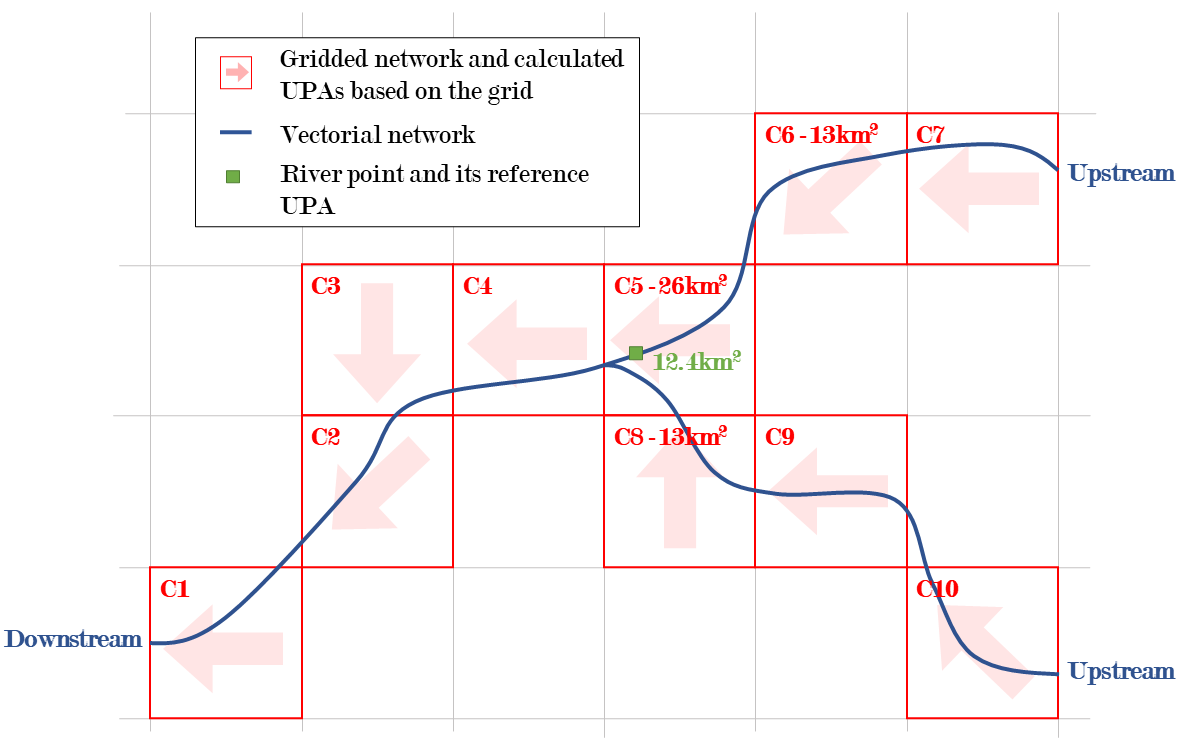
Figure 1: Example of allocation process failure when based on distance and upstream drainage area error criteria (Godet et al., 2024)
To tackle these errors, there has been a recent shift toward “contour-based” methods instead of the traditional “area-based” approaches. Contour-based methods compare the boundaries of the modeled and reference basins rather than just focusing on their drainage areas. This approach is promising because it theoretically reduces the likelihood of errors near confluences, as it considers the geographical location of upstream catchments in addition to their size.
Figure 2 shows this process: for cells near the gauging station, the modelled catchment boundaries are compared to the reference boundaries, and a mathematical score is used to measure the overlap, helping to select the most representative cell. We typically use the Critical Success Index (CSI), also known as the Intersection Over Union criterion or Fit Metric, which is a standard score for comparing surfaces. The Critical Success Index ranges from 0 to 1, with 1 indicating perfect overlap and 0 meaning no overlap at all.
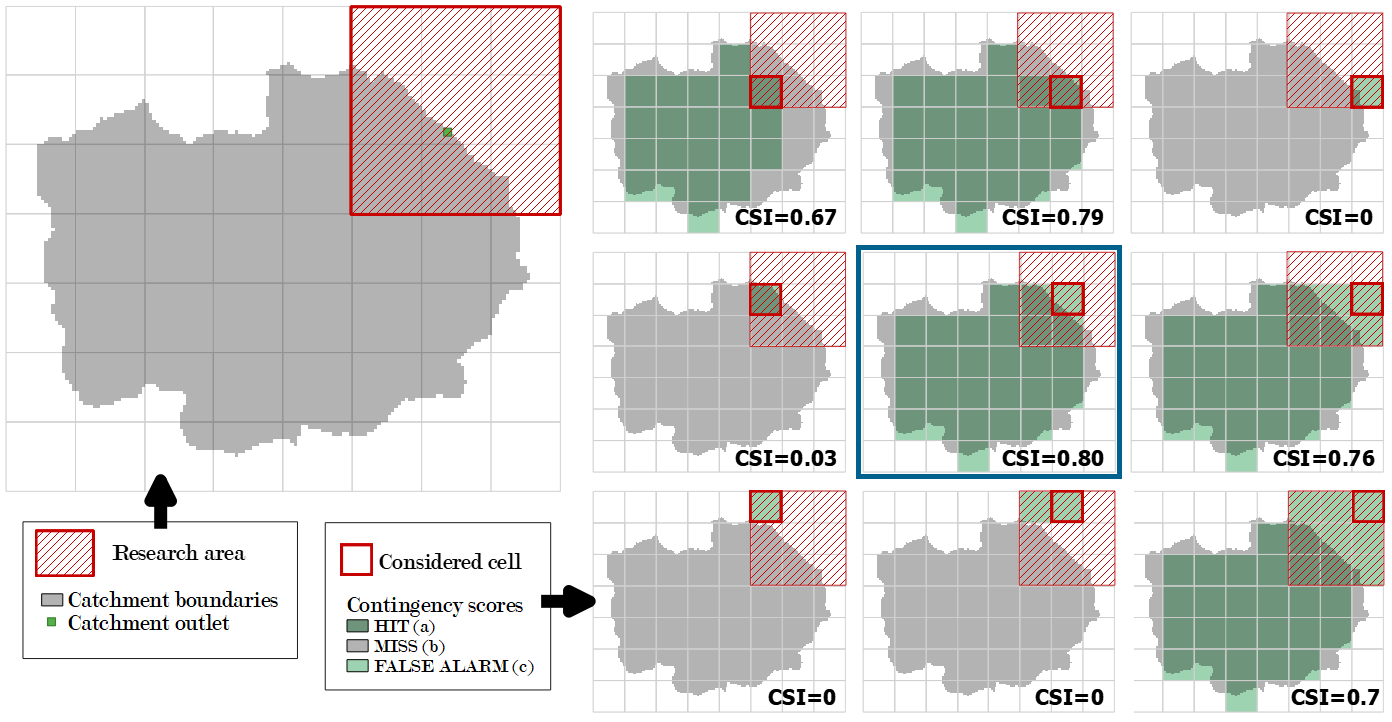
Figure 2: Illustration of “contour based” methods (Godet et al., 2024)
While contour-based approaches have been used in various contexts, area-based methods are still more common for allocating river points to grid cells. Additionally, the benefits of contour-based methods have not been fully quantified until now. To offer some insights, we compared the performance of both methods for allocating 2,580 river points in the French Mediterranean region. Our study used a 1 km² grid resolution, which is relatively coarse for regional studies.
Our results revealed that the difference between the methods depends a lot on the catchment size. Figure 3 shows that for basins smaller than 10 km², the contour-based method outperforms the area-based method. However, as catchment size increases, the performance difference diminishes: for larger catchments (>100 km²), both methods perform similarly. This supports the idea that area-based methods can be prone to errors near river confluences, especially in upstream parts of a catchment where small tributaries may have similar drainage areas. In these cases, the additional information about the geographical boundaries of the basin makes the contour-based approach much more effective. However, in downstream confluences, it’s less likely to encounter large catchments of similar sizes, which explains why the drainage area alone might be sufficient for correct allocation.
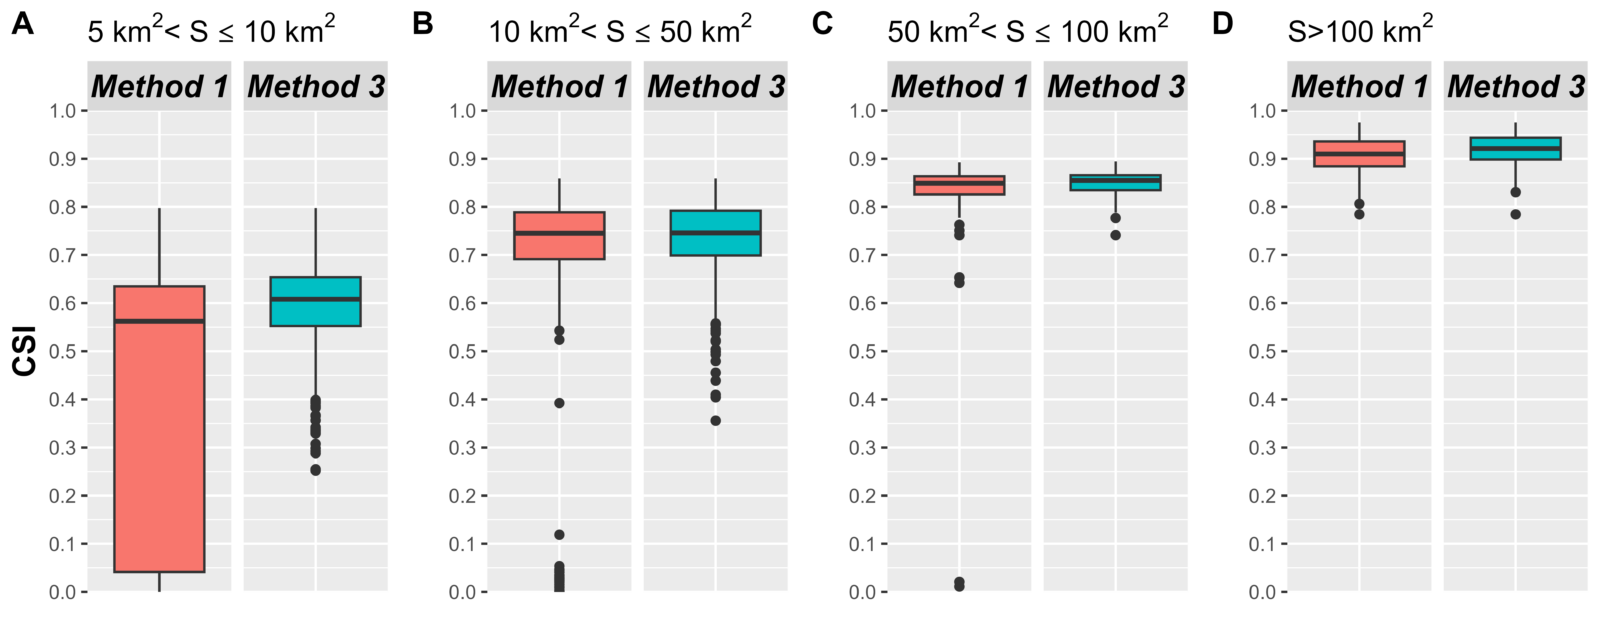
Figure 3: Boxplots of the performance of an “area-based” method (Method 1) and a “contour-based” method (Method 3). The Critical Success Index ranges from 0 to 1, with 1 corresponding to perfect performance (Godet et al., 2024)
Even though contour-based methods are not perfect and can struggle with small basins close to the grid resolution, they are generally better than area-based methods in many cases. Errors in small catchments are less problematic compared to those in larger catchments, due to less variability in rainfall at smaller scales.
So, here are a few takeaways:
- Contour-based methods generally outperform area-based methods: Especially in smaller catchments, where these methods significantly reduce errors.
- Performance differences decrease as catchment size increases: This likely explains why area-based methods are so widely used in previous studies, where the focus has often been on larger watersheds.
- Further research is needed: While our results are promising, they may not directly apply to other regions or scales. The complexity of hydrological processes means that more studies are necessary to fully understand these methods’ broader applicability.
For more details on the allocation methods, study area or validation metrics, check our article!