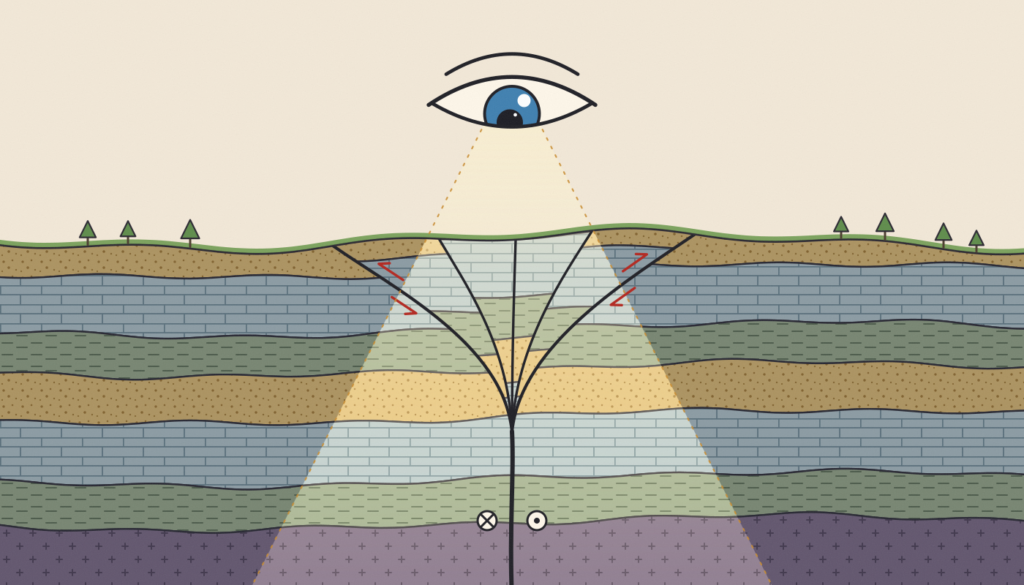
Can we see how a fault is shaped at depth without expensive surveys? Illustration by Hardy Nkodia.
For structural geologists, and for geoscientists in general, most analyses ultimately come down to one thing: imaging the Earth in 3D.
Imagine you are studying a major fault zone. You measure its geometry (strike and dip) in the field, and these measurements feed a variety of analyses: mapping, paleostress, kinematics. But all of this describes the surface. What about the fault at depth?
This is one of the most difficult tasks for a geoscientist: inferring the subsurface geometry of a fault zone without expensive tools, and doing it scientifically, meaning in a way that others could repeat with the same method and reach the same results. Like a medical doctor who cannot open up the patient, geologists rely on indirect techniques: electrical surveys, seismic reflection data, paleoseismic trenching, boreholes. These data are expensive or difficult to access, particularly for researchers in developing countries. We need low-cost approaches to work in 3D.
One way is to use big open repositories of geological data. This only works if such repositories exist. For earthquake data such as hypocentres and focal mechanisms, open catalogues are now common. For structural data, open sharing is still very limited, especially from massive data producers such as petroleum companies.
So the big question is: how can scientists achieve a 2D or 3D analysis at depth with few, inexpensive data?
Let me introduce two papers that achieve this brilliantly. They also face the same puzzle: the faulting regime seen near the surface does not match the one at depth. The first comes from my own work in South Korea, the second from Greece.
Korea: a flower hidden beneath the surface
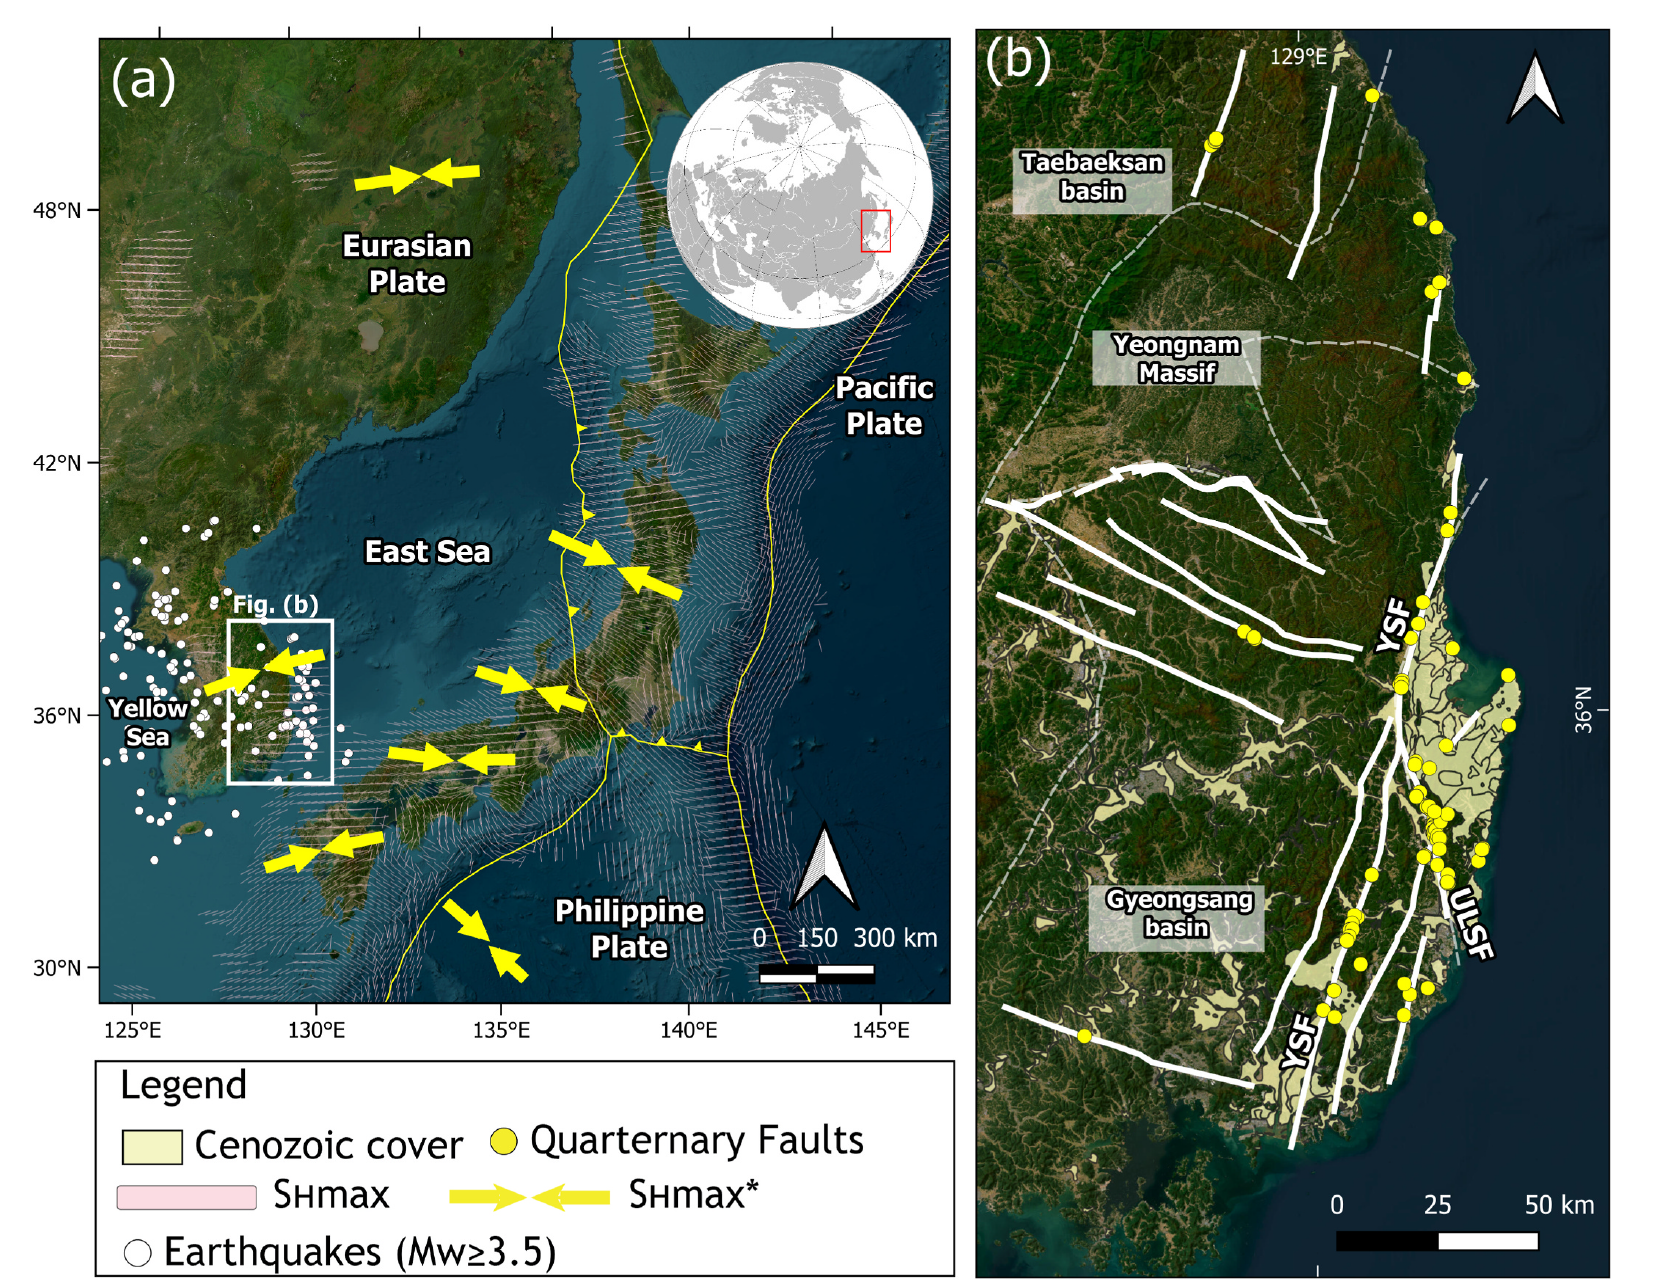
The southeastern Korean Peninsula is crossed by two major fault zones, the Yangsan Fault and the Ulsan Fault. Recent damaging earthquakes occurred near them, like the 2016 Mw 5.5 Gyeongju earthquake and the 2017 Mw 5.4–5.5 Pohang earthquake. These fault zones show a kinematic paradox: deep seismicity indicates strike-slip faulting, while the Quaternary faults observed at the surface are dominated by reverse faulting. The usual explanation is that the stress field changed through time.
Figure 1. Tectonic setting of the SE Korean Peninsula. (a) Regional plate setting and maximum horizontal stress (SHmax) directions; (b) major fault systems, including the Yangsan (YSF) and Ulsan (ULSF) faults, with mapped Quaternary faults. From Nkodia et al. (2026), Journal of Structural Geology, 211, 105778.
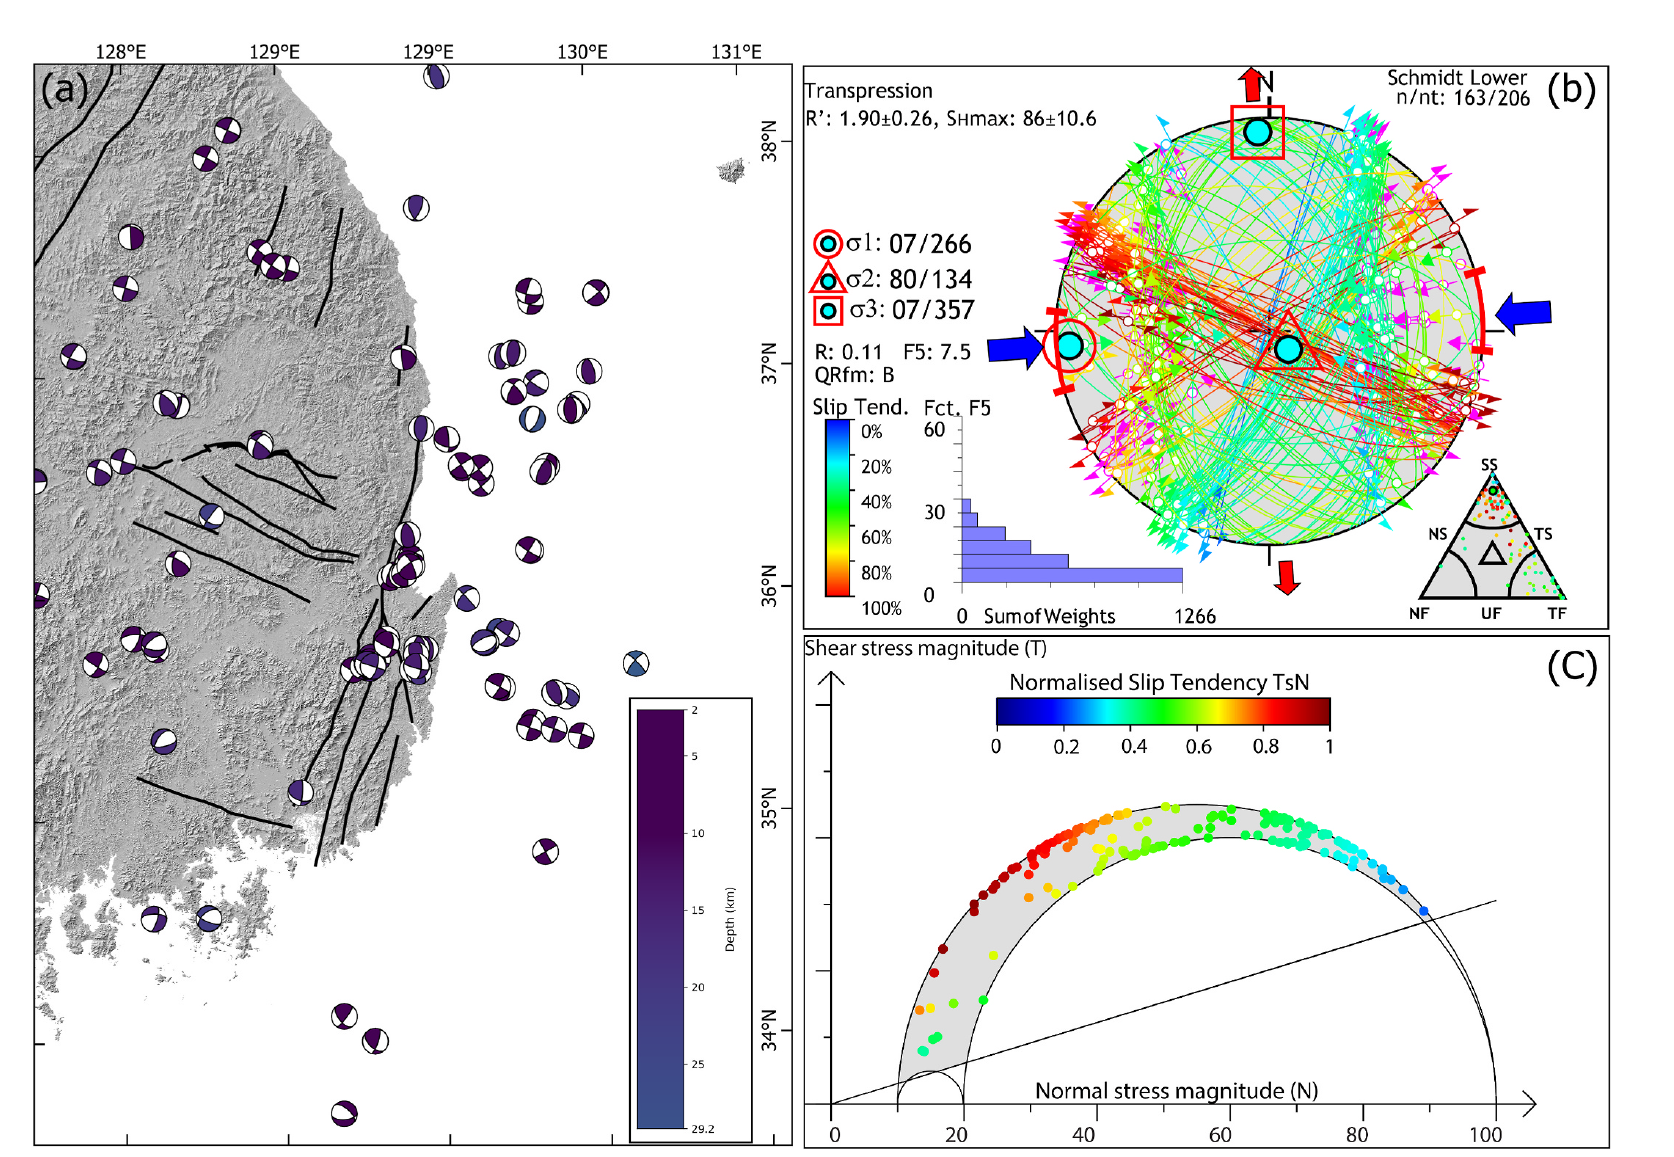
To test this, we needed to know what the faults look like at depth, without acquiring a single seismic profile. We combined two kinds of relatively cheap data: a compilation of Quaternary fault-slip measurements, and published focal mechanisms of earthquakes. Inverting the focal mechanisms gives the present-day stress field: strike-slip, with an E-W maximum horizontal stress. Every focal mechanism has two possible nodal planes, so we used this stress field to select the one most likely to be the real fault plane.
Figure 2. Present-day stress field of SE Korea inverted from earthquake focal mechanisms: a strike-slip regime with E-W maximum horizontal compression (σ1 ≈ N266°). This deep stress field contrasts with the reverse faulting recorded at the surface. From Nkodia et al. (2026), Journal of Structural Geology, 211, 105778.
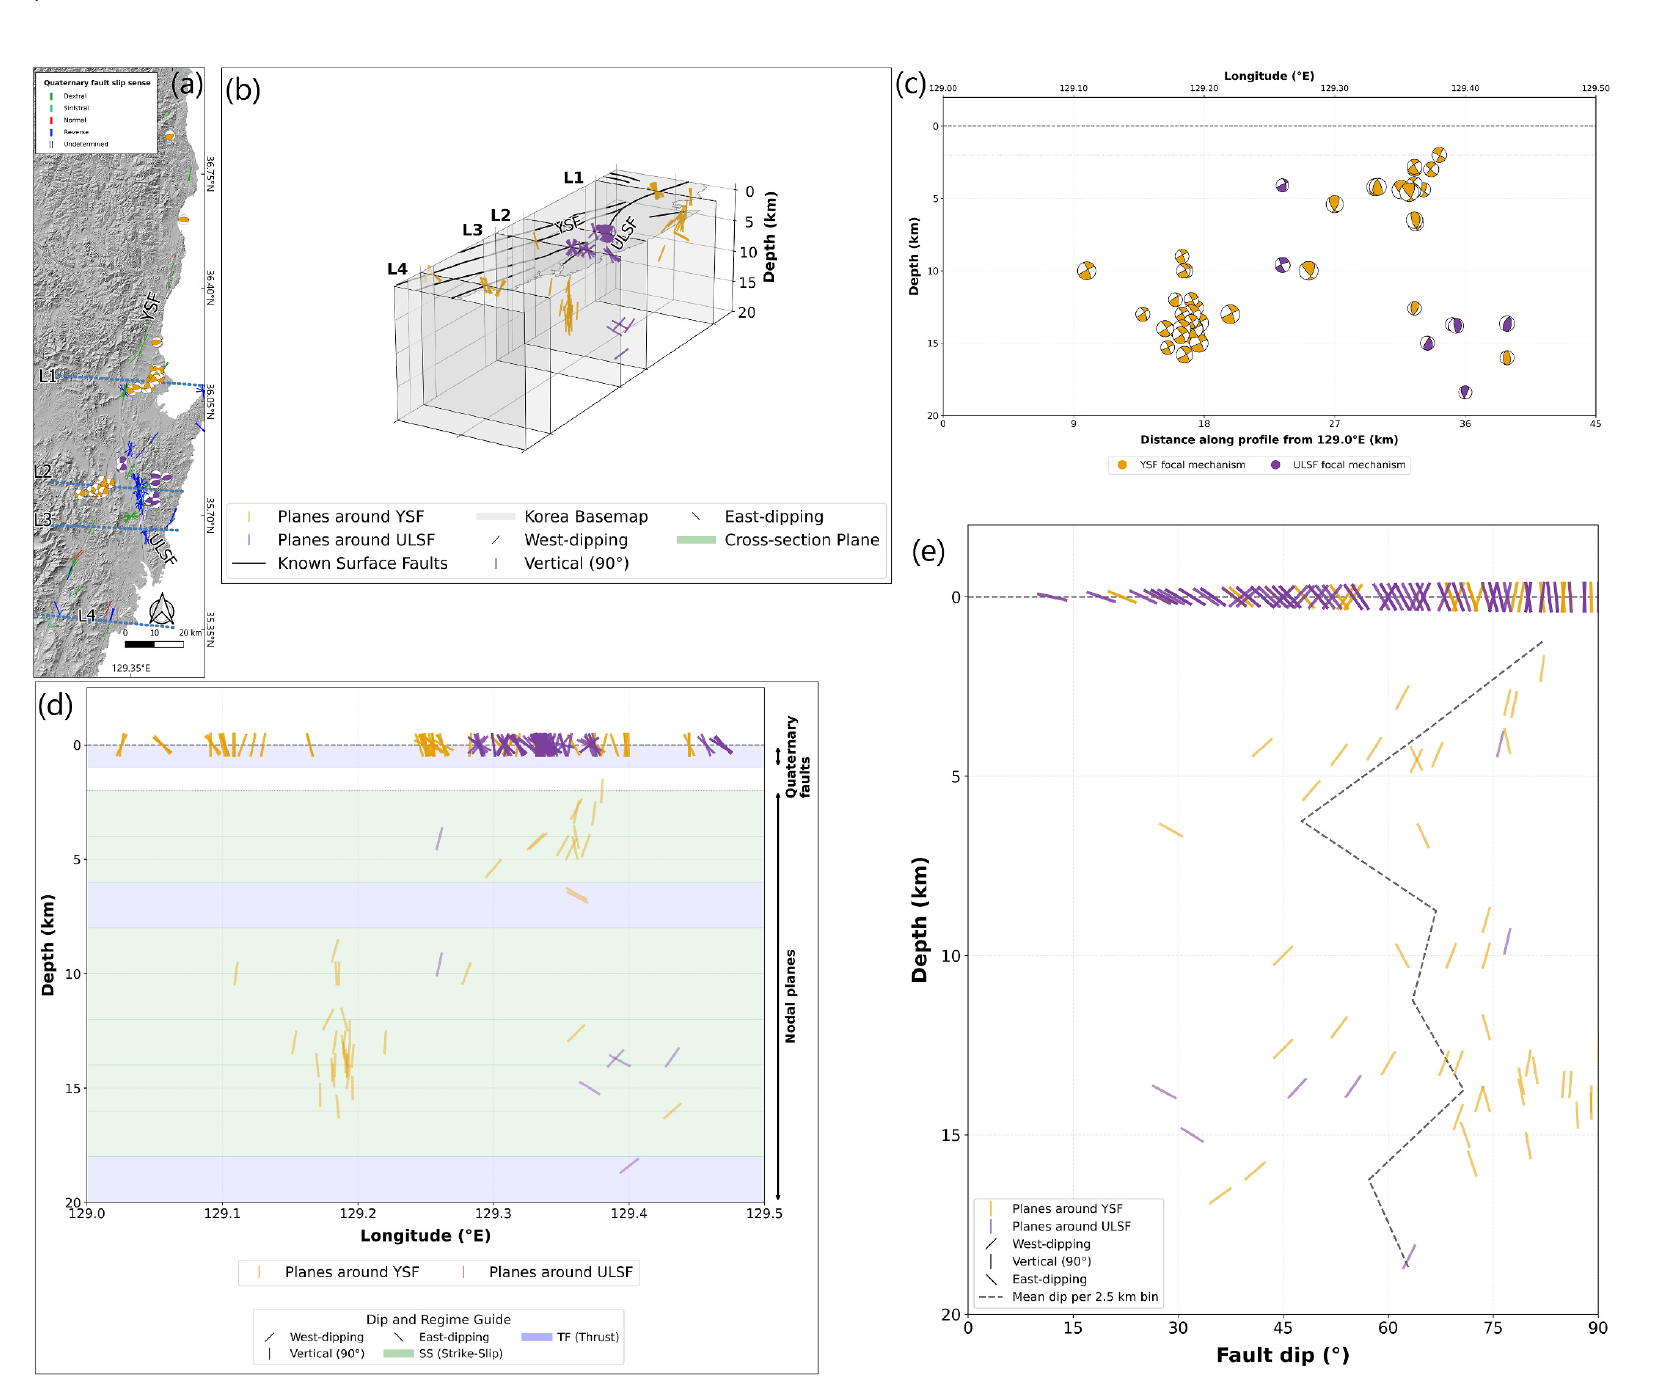
We then projected these planes and their dips onto cross-sections through the Yangsan and Ulsan faults, together with the surface faults.
Figure 3. Linking surface faults to deep earthquake planes along the Yangsan (orange) and Ulsan (purple) faults. Fault dips steepen with depth: steep, near-vertical strike-slip planes at depth branch upward into lower-angle reverse splays near the surface, forming a flower structure. From Nkodia et al. (2026), Journal of Structural Geology, 211, 105778.
The picture is clear. Steep to sub-vertical strike-slip planes at depth (74–87° between 8 and 16 km along the Yangsan Fault) branch upward into lower-angle reverse splays near the surface, like a positive flower structure. So the paradox does not need a change of stress through time. It is explained by vertical partitioning of deformation within the same transpressional system. This matters for hazard: trenching the shallow reverse splays alone may underestimate the strike-slip rupture potential of the deep fault cores.
Greece: the same puzzle in the Gulf of Patras
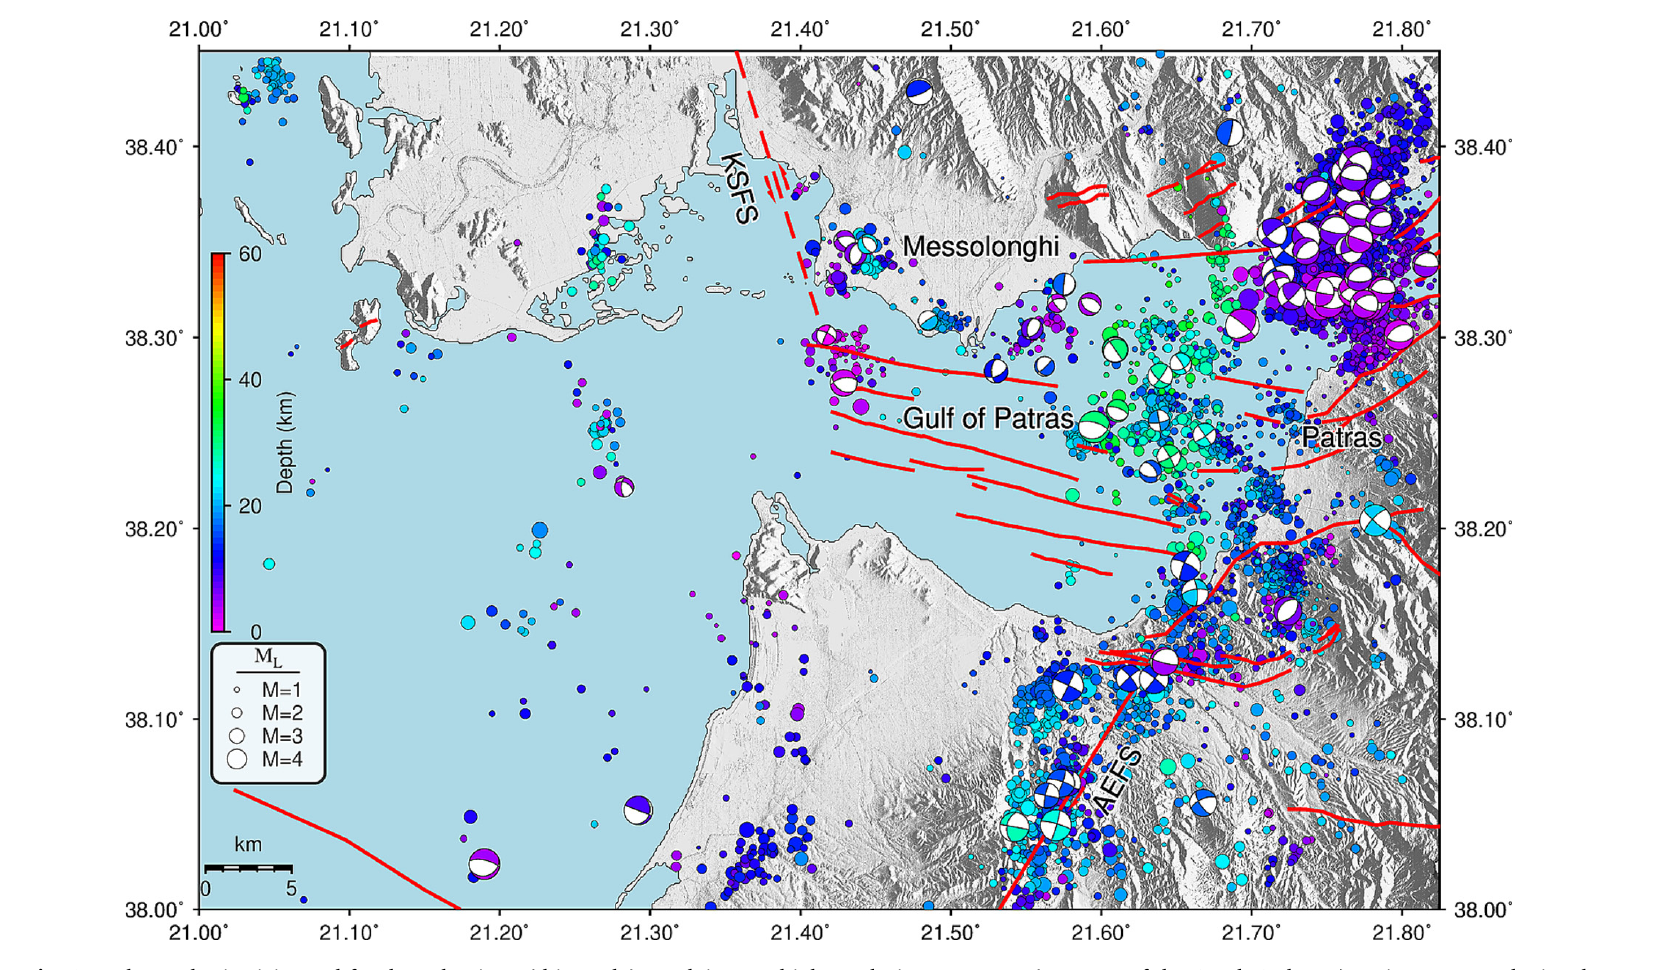
The Gulf of Patras lies at the western end of the Corinth Rift, where extension along the rift gives way to oblique compression near the Hellenic Subduction System. Nikolopoulou and colleagues did not deploy new instruments. They used 11 years of recordings (2011–2022) from the existing regional seismic network and relocated 5,091 earthquakes with the double-difference method. They then computed 74 focal mechanisms and inverted them for stress, separately for different depth ranges.
Figure 4. Relocated seismicity (2011–2022) and focal mechanisms in the Gulf of Patras, Greece, coloured by depth. Built entirely from existing regional seismic network records, without new field instruments. From Nikolopoulou et al. (2025), Tectonophysics, 913, 230889, CC BY 4.0.
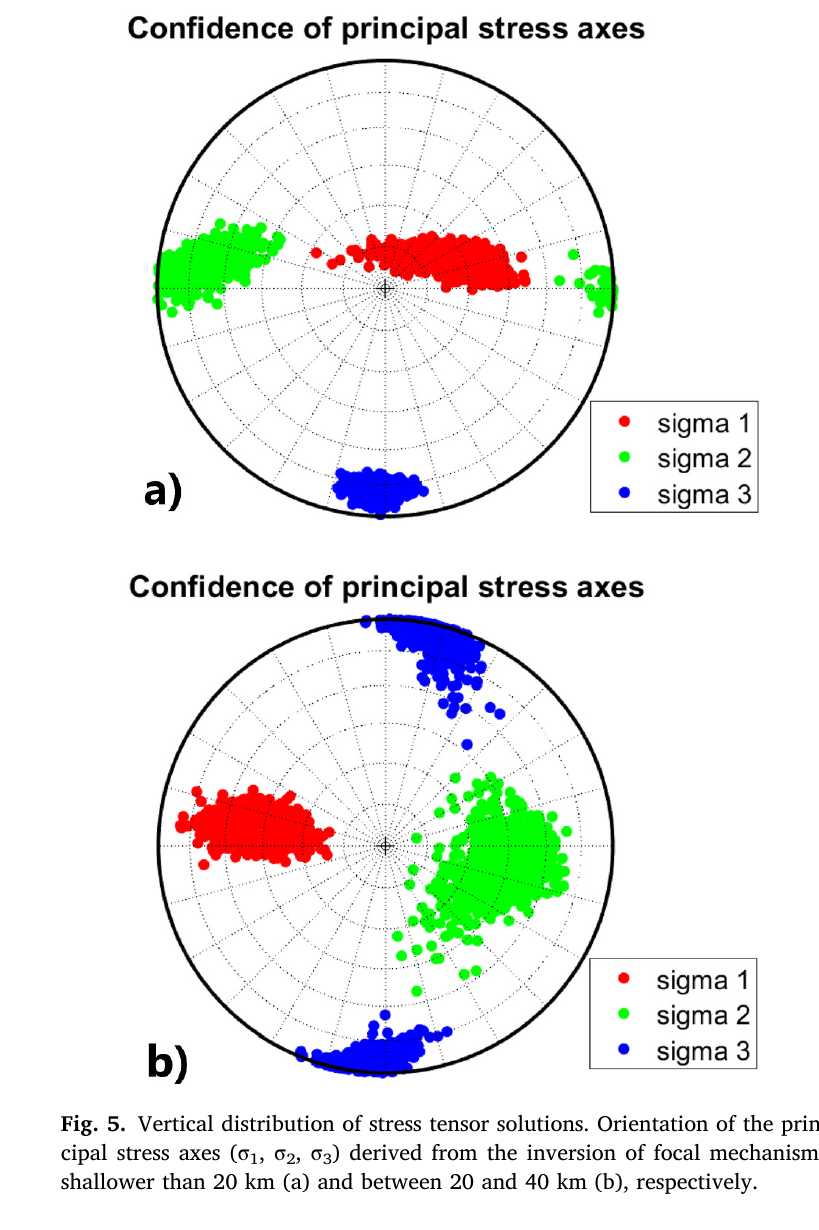
Here too, the regime changes with depth. Shallow earthquakes (less than 20 km) mostly show E-W normal faulting, while deeper ones (20–40 km) are strike-slip. Between these two depth ranges, σ1 and σ2 swap, while σ3 stays horizontal and N-S.
Figure 5. The same stress field, two depths: sigma 1 and sigma 2 swap places with depth in the Gulf of Patras. Normal faulting dominates above 20 km (a), strike-slip faulting between 20 and 40 km (b), while sigma 3 remains horizontal and N-S. From Nikolopoulou et al. (2025), Tectonophysics, 913, 230889, CC BY 4.0.
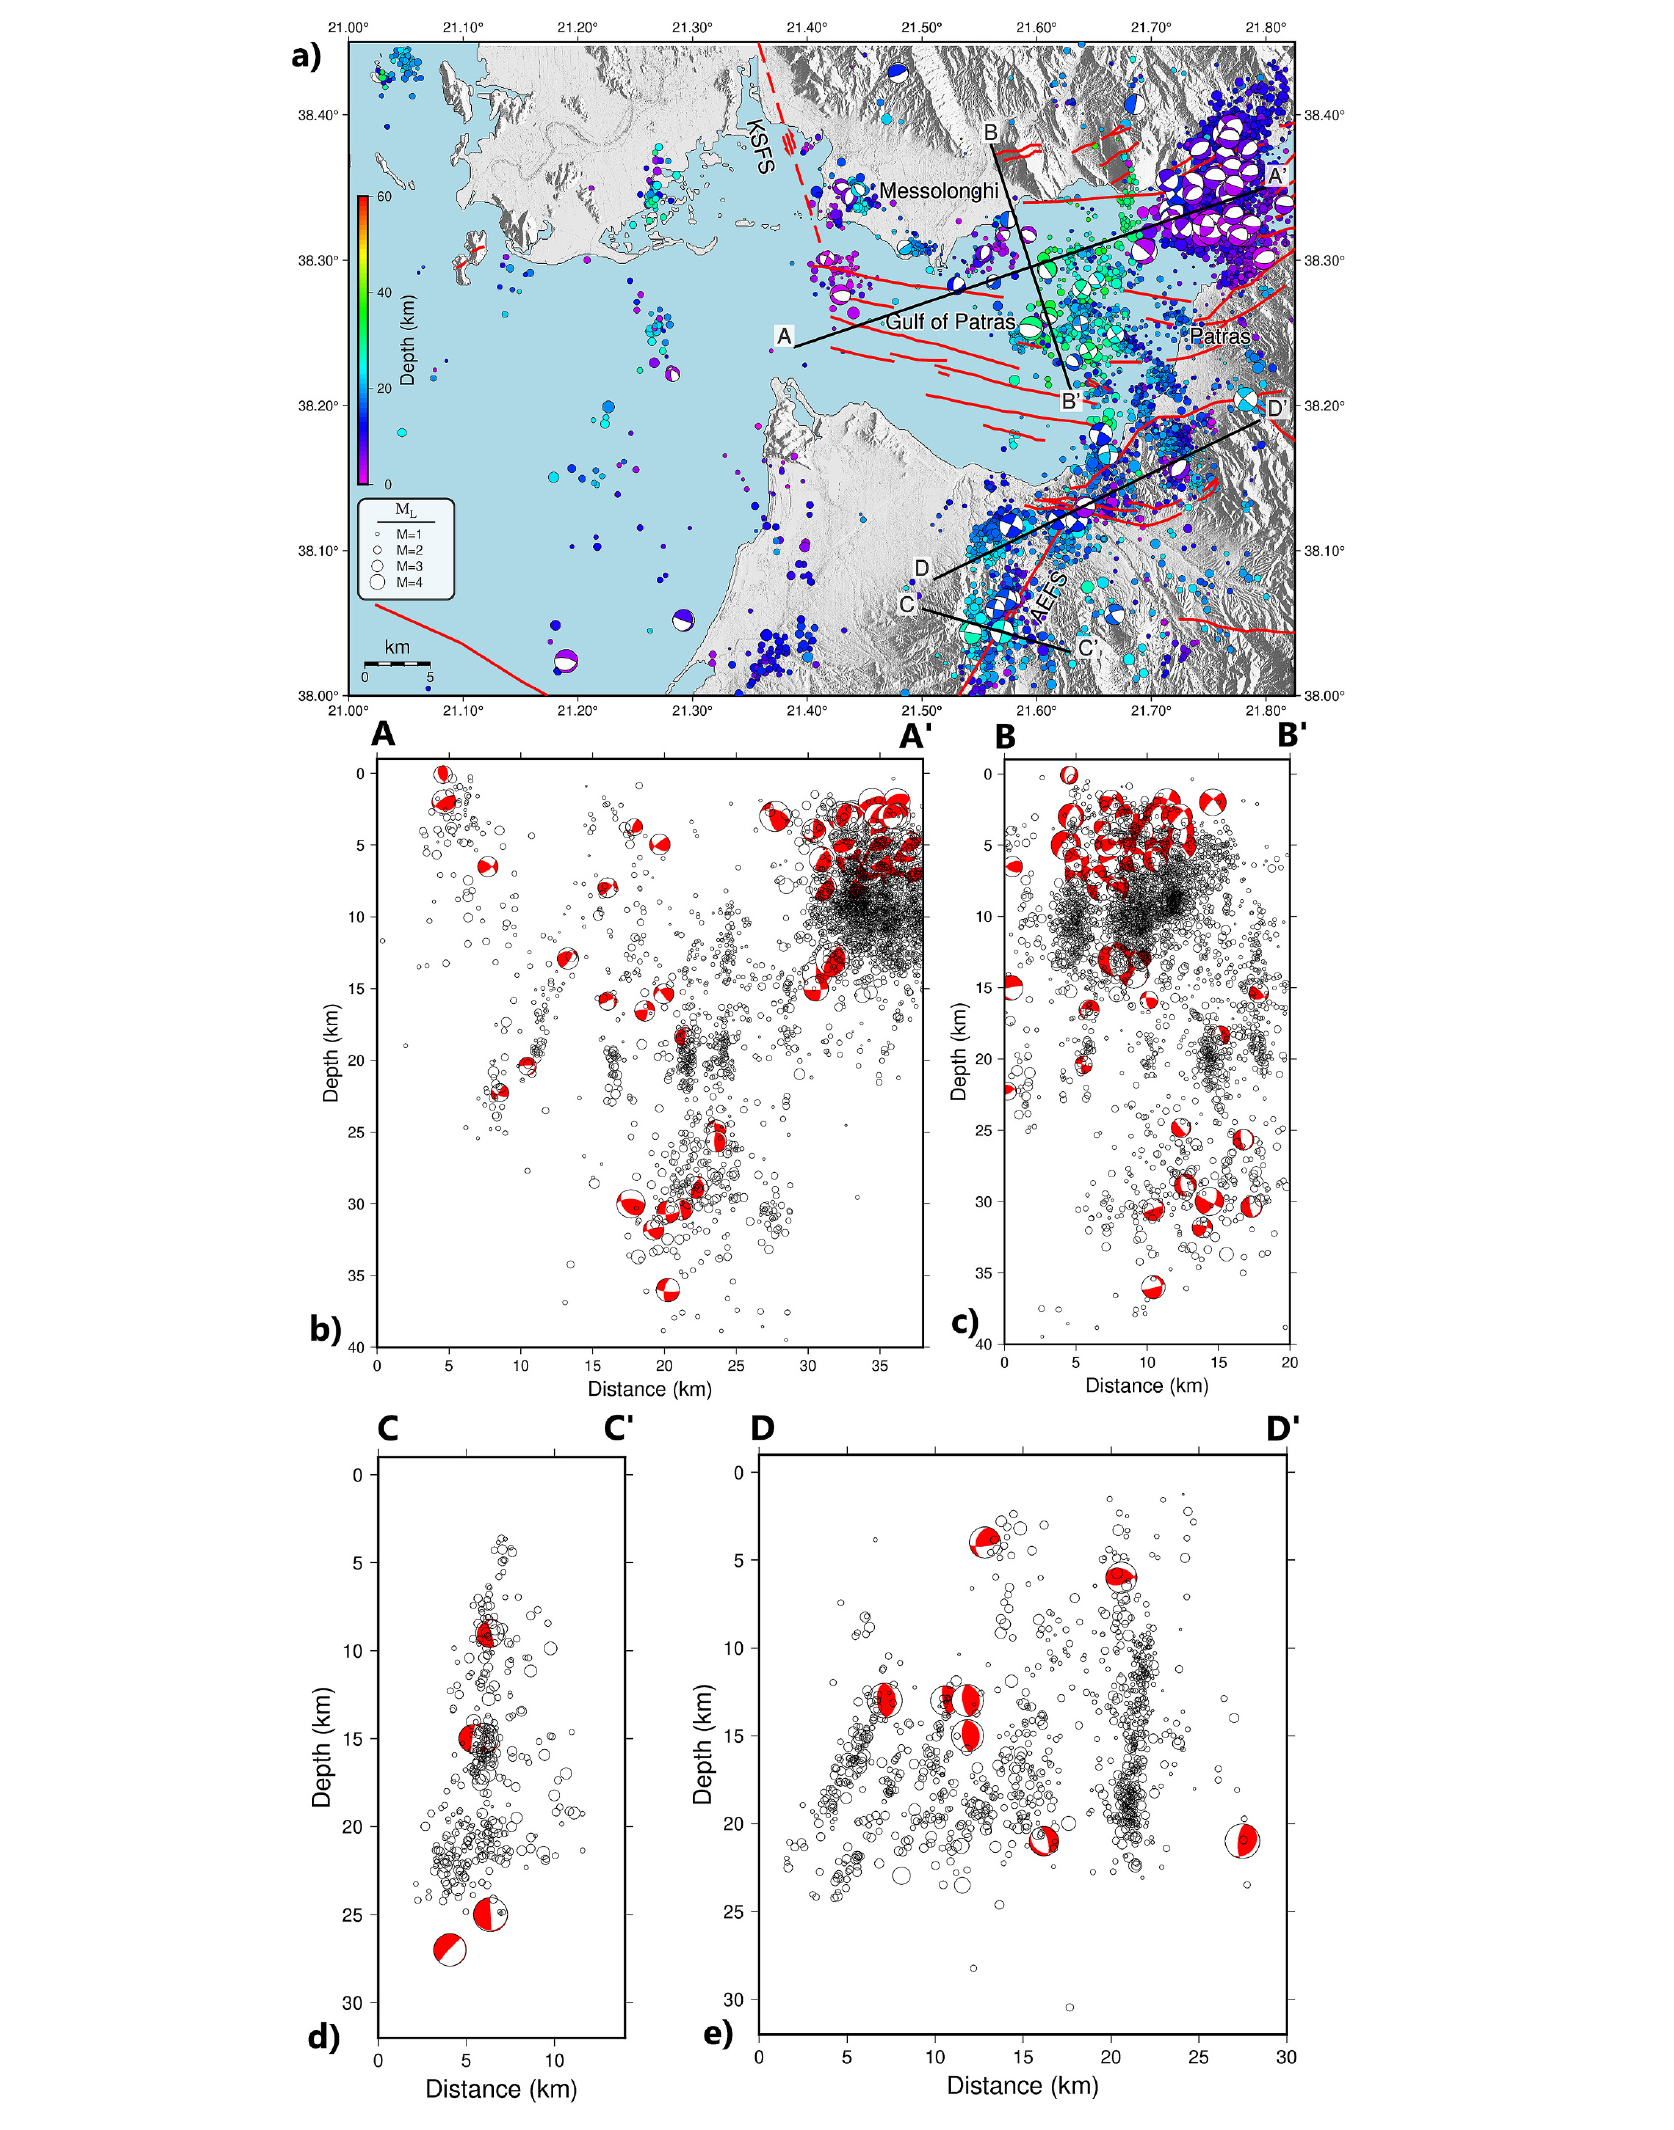
In cross-sections, the relocated hypocentres line up in vertical clusters down to about 20–25 km. They outline three parallel NW-SE faults across the gulf that had not been mapped, possibly linking active faults on both sides, with implications for the seismic hazard of the city of Patras. The authors honestly leave open what drives this stress permutation.
Figure 6. Seeing faults at depth from earthquakes alone: in cross-section, relocated hypocentres in the Gulf of Patras line up in vertical clusters down to about 20–25 km, revealing previously unmapped faults beneath the gulf. From Nikolopoulou et al. (2025), Tectonophysics, 913, 230889, CC BY 4.0.
What these two cases tell us
Neither study ran a new seismic survey. Both turned data that already existed (earthquake catalogues, routine network recordings, field measurements) into an image of faults at depth, with methods others can repeat. Geoscientists can make their way with available data, and even low-cost data can help us understand the subsurface.
But this works because earthquake data are open. Imagine if subsurface structural data were open too: seismic profiles, borehole logs, fault measurements. A global effort to make subsurface data available would really help build 3D fault models, anticipate hazards and avoid duplicate research, especially for researchers in places where every survey counts.
References
Nkodia, D.-V. M. H., et al. (2026). Vertical kinematic partitioning in intraplate fault systems: Evidence from the SE Korean Peninsula. Journal of Structural Geology, 211, 105778. https://doi.org/10.1016/j.jsg.2026.105778
Nikolopoulou, I., Sokos, E., Roumelioti, Z., & Mouslopoulou, V. (2025). Seismotectonics of the Gulf of Patras, Central Greece: New insights from earthquake relocation, focal mechanisms and stress inversion. Tectonophysics, 913, 230889. https://doi.org/10.1016/j.tecto.2025.230889
I’m Hardy Nkodia, PhD in Tectonics & Structural Geology from the Republic of Congo. I work as a Research Assistant and Lecturer in Marien Ngouabi University in Congo, and I’m beginning a postdoc at the Active Fault & Earthquake Hazard Mitigation Research Institute, Pukyong National University (South Korea). I study structural geology, paleostress, paleoseismology, and mining, with a passion for using GIS to make geodata open to all. I love turning complex ideas into clear explanations and mentoring students.