We interview Nikolaj Dahmen, a PhD student at ETH Zurich’s Institute of Geophysics, about how he uses Machine Learning methods to detect Marsquakes using data from NASA’s InSight Mission….
Why are marsquakes important to detect?
Marsquakes generate seismic waves that travel from its source through the interior of the planet. The recordings of these waves carry information about the medium through which they have passed and, if analysed, can reveal its nature. In addition to taking a glimpse at the interior structure of Mars, we also want to know how seismically active the planet is. Mars does not have active plate tectonics as we know from Earth, so we are trying to understand where marsquakes come from and what causes them. Answering these and other questions begins with collecting marsquakes.
Which data set are you working with?
We work with the seismic data collected by NASA’s InSight mission. The InSight lander arrived in Elysium Planitia in November 2018 and carried several geophysical instruments, including a seismometer package. The seismometer was installed on the Martian surface (Fig.1) and started the collection of seismic data at the beginning of 2019. By now, we have a near-continuous data set of over three and a half years, or a little under two Martian years, and have identified over 1300 marsquakes.
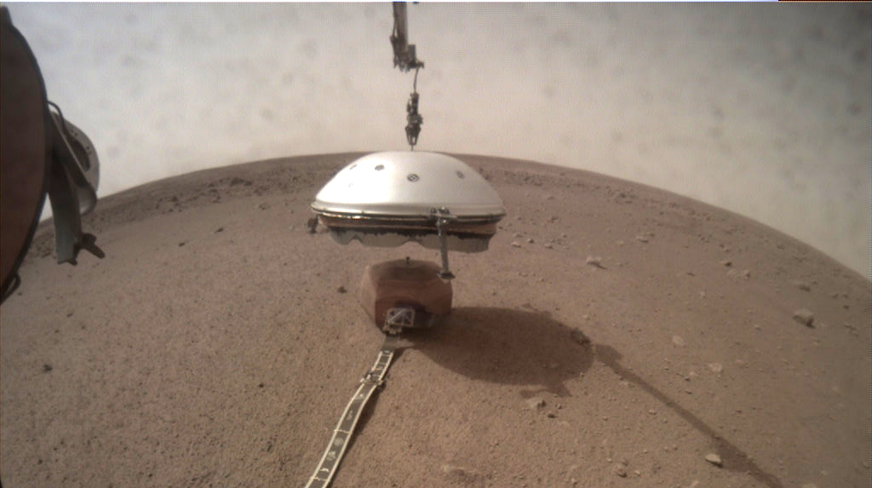
Figure 1: View of seismometer package being covered by wind and thermal shield. Modified from https://mars.nasa.gov/insight/multimedia/raw-images/, NASA/JPL-Caltech
How have Marsquakes been detected so far?
This task is done by the Marsquake Service (MQS) – a group of seismologists that manually reviews the seismic record, identifies marsquakes, and compiles the MQS catalogue, including event type, the epicentral location or distance, and magnitude. Thanks to the careful review, the MQS catalogue is probably pretty complete for all major events that have high signal-to-noise ratio (SNR).
What do seismic data look like and why not use conventional detection methods?
The seismometer we have on Mars is extremely sensitive and measures ground displacement that can be as small as a couple of ångström (10-10m). As a result, the InSight seismometer can record magnitude 1.5-2.5 marsquakes at 1500 km distance. This is not only possible because of the sensitive instruments, but also because there is no microseismic noise on Mars and, of course, no anthropogenic noise. However, we have a couple of other noise signals that can be quite high compared to marsquake amplitudes. During vast parts of the Martian day, the winds at the landing site are strong and shake the lander and seismometer system. These motions are picked up by the seismometer and elevate the seismic noise level (Fig.2). Additionally, the seismometer system is exposed to large diurnal temperature changes in the order of 80 Kelvin that causes thermal stresses. The stress release then generates various types of high-amplitude spikes or glitches in the seismic data (Fig.2&3). Wind and thermal signals were reduced by placing the seismometer on the ground next to the lander and under a wind and thermal shield (Fig.1). This drastically lowered the noise compared to a setup with a seismometer on the deck of the lander, which was used by the Viking lander in the 1970s.
Despite these measures to reduce the noise, the atmospherically-induced noise remains in the seismograms and may corrupt or hide marsquakes.
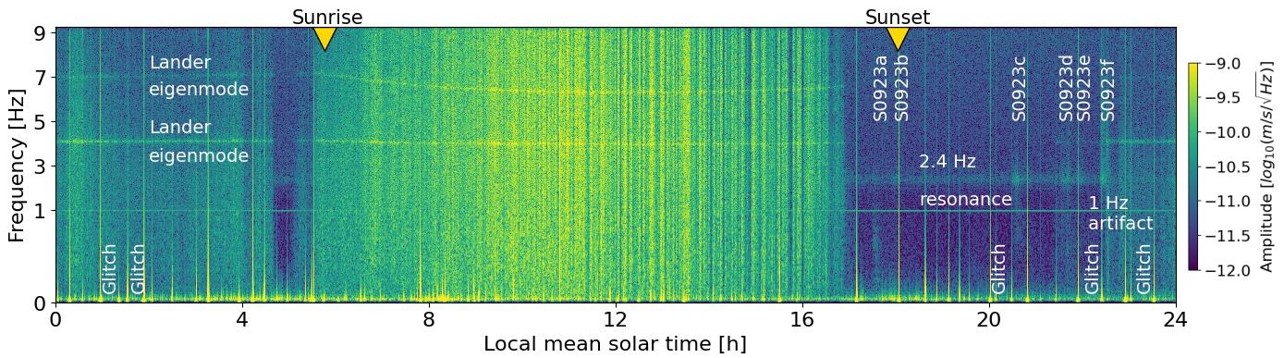
Figure 2: Day-long spectrogram of the vertical component Martian seismic data, recorded by the Very Broadband instrument. Visible are the changes from high noise during the day (yellow) to low noise in the evening (blue); annotated are also six marsquakes catalogued by Marsquake Service (S0923a-f; S0923a has most energy below 1 Hz, while other events have energy around 2.4 Hz), and other typical features of the noise. Modified from [1].
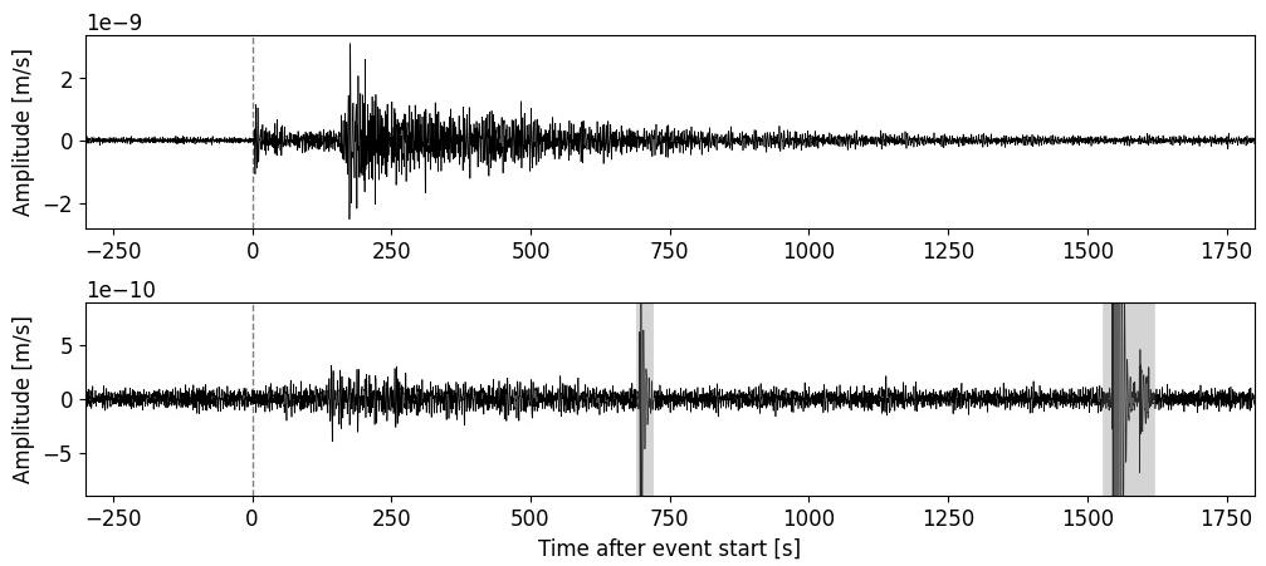
Figure 3: Examples of marsquake seismograms. (top) one of the highest quality events of the mission (S0235b) with clear P and S wave arrivals; (bottom) a rather low quality event (S0936b) which is only slightly visible in time domain between 150-250s after event start; also visible are several large glitches (marked in grey). Both waveforms show the vertical component filtered between 0.2-0.8 Hz.
How do you use machine learning to find marsquakes?
We use a convolutional neural network (CNN) in an encoder-decoder architecture to detect marsquakes in a supervised approach. This architecture was originally designed for medical image segmentation [2] – a task where the CNN consumes 2D images and produces 2D segmentation masks. These masks correspond to a pixel-wise classification of the image into areas with common class labels, so a partitioning of the image in image segments. The same approach can be used on time series data after the transformation to a time-frequency domain that results in a 2D representation of the data, similar to images (e.g. spectrograms). For example, a CNN can then learn the properties of individual musical instruments or voices in songs, and identify and separate them [3]. Similar to a song, the seismic signal can be understood as a superposition of different signals such as marsquakes and noise energy which can be identified with a CNN. In detail, the CNN consumes the time-frequency representation of the seismic data and predicts masks that identify event and noise energy in each time-frequency bins. The masks can be used to detect events and denoise seismograms, as shown by the quite spectacular results on earthquake data (e.g., [4]).
We extended this approach to work on the three-component seismic data from InSight to detect events and denoise the seismograms (Fig.4). The main challenge is to construct a data set for training. On Earth, researchers often have extensive earthquake catalogues (>> 10k earthquake waveforms) to mine, while on Mars, we only have about 1300 known events that we could use for network training. These events are very unevenly distributed among different event types, and further, most are of low quality. Our approach was to first build a data set with synthetic event waveforms that were modelled to have similar characteristics to the known event types in the MQS catalogue (MQS distinguishes five event types by their frequency content). Synthetic event samples were then combined with recorded noise from the InSight seismometer with varying SNRs. By doing so, the network directly learns all types of noise which are part of the recordings – in addition to the atmospheric noise, these include: spikes/glitches, wind-excited eigenmodes of the lander, sensor cross-talk, various pressure signals, and many other rather unusual and InSight-specific signals.
Our CNN, called MarsQuakeNet (MQNet), then predicts event and noise masks for any given data, which we use to 1) collect detections, and 2) to denoise the marsquake seismograms.
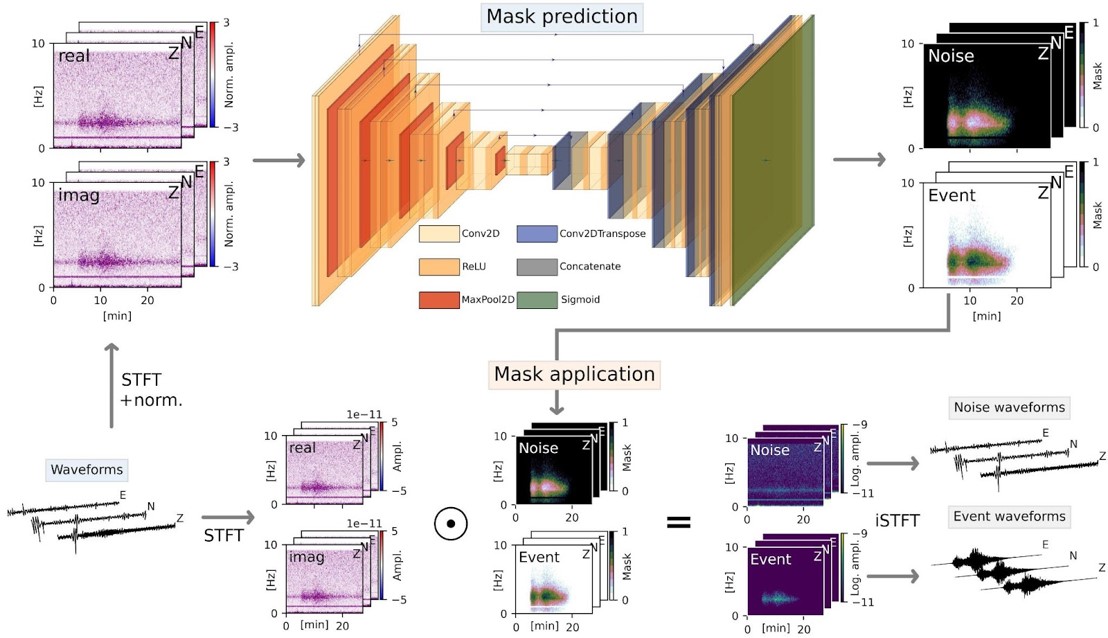
Figure 4: Workflow for mask prediction and application. The seismic data are transformed to time-frequency domain using the short time Fourier transformation (STFT) and serve as the input for the CNN after normalisation; the predicted output of the CNN are event and noise masks. Next, the event and noise masks are multiplied with the STFT coefficients to estimate the event and noise time-frequency representation or waveforms (after inverse STFT). Figure taken from [1].
Machine learning methods can also be used in other ways to support event detection: Alex Stott and collaborators [5] have shown how neural networks can predict the seismic noise levels based on recordings from atmospheric sensors (pressure, wind, temperature) that are part of the InSight lander. As these recordings correlate with the seismic noise, they can be used to estimate it in. Marsquakes can then be found and confirmed by looking for differences between the predicted atmospheric seismic noise and the actual recorded noise.
Are there limitations of using machine learning for this investigation?
Our machine learning methods extend the event catalogue to events with lower SNRs, so mainly very weak events in the quiet evening period or stronger events that were hidden in the night-time noise (Fig.2). However, during vast parts of the day, the noise level is many times higher than typical event amplitudes, which means that even with improved methods we do not find many events then.
What programmes/code do you use to carry out the ML procedures?
Personally, I had great experiences with the deep learning library TensorFlow which also includes the Keras API. The functionality is great and the official documentation is helpful – in addition, there are many third-party code examples, implementations and explanations available which makes it usually easy to use and create a model for a given problem.
What is a typical day for you working on this project?
Of course, working with data from Mars means there is no fieldwork, and most of the work is done on the computer. It is really exciting to be part of the InSight science team, which gives me the opportunity to join various working groups and hear about the latest news and findings of the mission, see how big projects are organised and work together with people outside of my university. I’m also part of the Marsquake Service, the group which gets to see the seismic data first and catalogues new events. This is cool – especially when we see another big marsquake – and of course helpful for my own project!
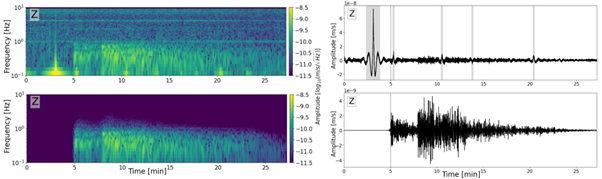
Figure 5: Example of another high quality marsquake (S0173a): spectrogram and waveforms before (top) and after denoising (bottom) with MarsQuakeNet (vertical component). Several large glitches are visible in the data before denoising (marked in grey).
What do you hope to find out in the future?
So far, we have focused on the detection of new marsquakes – next we want to see how the denoised waveforms (Fig.5) from the CNN can be used to support locating and characterising marsquakes. For example, many of the events have such a low SNR that it is quite hard to confidently make phase picks, and we hope that our CNN can help in these cases. Apart from this project, I am super interested so see what other researchers will do with the data, especially with regard to some of the big recent marsquakes. Unfortunately, data collection from the InSight mission appears to be slowly coming to an end as more and more dust accumulates on InSight’s solar panels, reducing the lander’s available power. We still have a bit of hope that a dust devil will clean the solar panels (Fig.6), but the chances of this happening are slim. In any case, the InSight mission has collected plenty of data and I believe that there are still many hidden things to discover and analyse for years to come, until perhaps we will have a new mission to Mars!
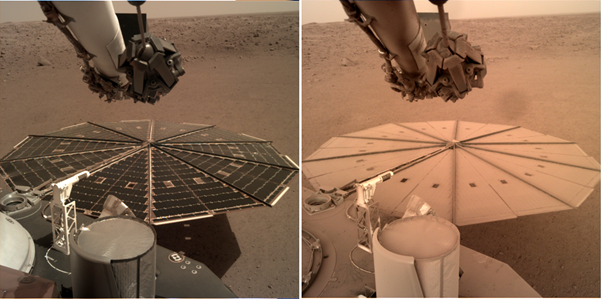
Figure 6: Dust accumulation on InSight’s solar panels. Images taken by the camera of InSight’s robotic arm on (left) Sol 10 (Dec. 7, 2018) and years later on (right) Sol 1238 (May 21, 2022). Modified from https://mars.nasa.gov/insight/multimedia/raw-images/, NASA/JPL-Caltech
Have there been any initiatives to engage the wider public with this work?
The InSight team has several initiatives to promote the use of the data and to make it more accessible for the whole community. These include newsletters, workshops and the Mars@school program (https://insight.oca.eu/fr/accueil-insight and https://mars.nasa.gov/insight/participate/overview/), and the opportunity to join InSight team meetings as an early-career researcher within the InSightSeers program.
Anyone who would like to take a look at marsquakes themselves: the seismic data and the Marsquake Service catalogue are available at IPGP dataset, PDS Geoscience Node and IRIS DMC (https://www.iris.edu/hq/sis/insight). A detailed description of the data and marsquakes can be found in, e.g. [6] and [7].
References for further reading:
[1] Dahmen et al. (2022), MarsQuakeNet: A More Complete Marsquake Catalog Obtained by Deep Learning Techniques. https://doi.org/10.1029/2022JE007503
[2] Ronneberger et al. (2015). U-Net: Convolutional Networks for Biomedical Image Segmentation. https://doi.org/10.1007/978-3-319-24574-4_28
[3] Jansson, Andreas, et al. (2017), Singing voice separation with deep u-net convolutional networks..
[4] Zhu et al. (2019). Seismic Signal Denoising and Decomposition Using Deep Neural Networks. https://doi.org/10.1109/TGRS.2019.2926772
[5] Stott et al. (2022), Machine learning and marsquakes: a tool to predict atmospheric-seismic noise for the NASA InSight mission. Submitted to GJI, https://doi.org/10.31223/X58H1F
[6] Clinton et al. (2021). The Marsquake catalogue from InSight, sols 0–478. https://doi.org/10.1016/j.pepi.2020.106595
[7] Ceylan et al. (2021). Companion guide to the marsquake catalogue from InSight, Sols 0–478: Data content and non-seismic events. https://doi.org/10.1016/j.pepi.2020.106597

Ferry
Fascinating project! Do you think similar machine learning approaches could one day help detect quakes on other planetary bodies, like Europa or Titan?