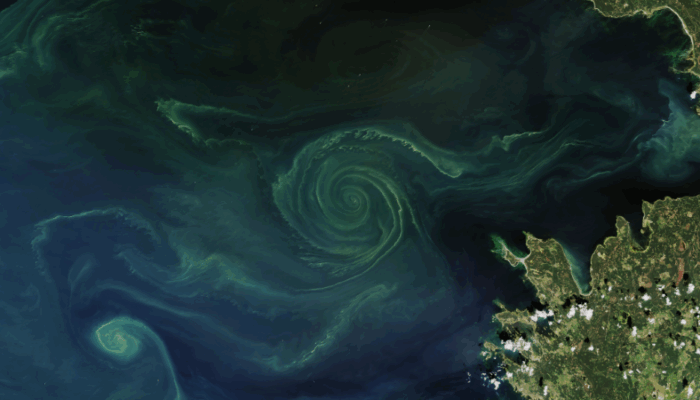
Phytoplankton are tiny, single-celled organisms mainly found in the ocean’s sunlit surface, where they grow through photosynthesis, forming the marine food web’s base and regulating Earth’s climate by absorbing carbon dioxide. Their seasonal growth cycles—known as “blooms”—drive marine productivity and influence everything from carbon uptake to food security. But how can we track these blooms across the vast, dynamic global ocean? A new satellite-derived dataset just made that a whole lot easier.
A new global tool for ocean scientists
In a new study published in Earth System Science Data, Nicholson et al. (2025) present a global satellite dataset of phytoplankton phenology metrics spanning 25 years (1997 to 2022), with plans for regular updates. Using chlorophyll-a observations from the ESA Ocean Colour Climate Change Initiative (OC-CCI) as a proxy for phytoplankton biomass, the dataset provides eight key indicators of bloom dynamics—initiation, termination, duration, peak timing, peak chlorophyll, mean chlorophyll, integrated chlorophyll, and seasonal cycle reproducibility. These metrics are derived using three established detection methods (threshold-based, cumulative sum, and rate of change) and are available at three spatial resolutions (4 km, 9 km, and 25 km), supporting both regional and global-scale applications. As the first global product of its kind to offer multi-method phenology estimates, it is compatible with Earth System Model validation and biodiversity assessments. The dataset is open access and freely available via Zenodo with planned annual updates.
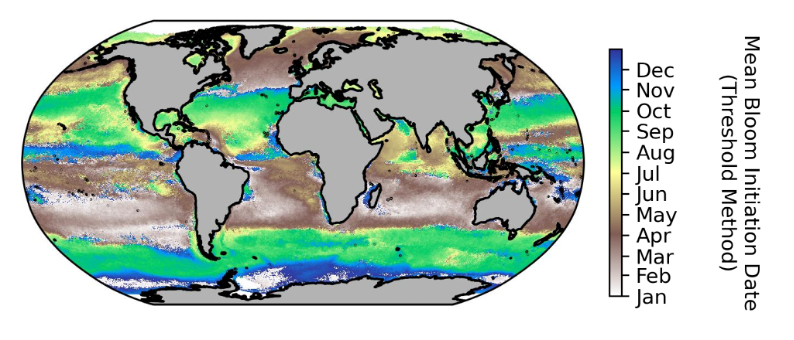
Global bloom initiation (1998–2022). (Credit: Nicholson et al., 2025, ESSD (CC BY 4.0))
What is Phytoplankton Phenology?
Phenology is the study of the seasonal timing of biological events in natural systems. In the ocean, phytoplankton phenology focuses on when blooms begin, peak, and end, as well as how long they last each growing season. This new data product goes a step further by also capturing the amplitude of seasonal blooms and their characteristics of variability. These seasonal patterns can be monitored globally using satellite-derived ocean colour data, which serves as a proxy for phytoplankton biomass.
Why track phytoplankton phenology?
Phytoplankton form the base of the marine food web and play a key role in the biological carbon pump, removing carbon from the atmosphere and transporting it to the deep ocean. The timing of their blooms affects the whole ecosystem. For example, mismatches between bloom timing and zooplankton grazing can lead to suboptimal food conditions for higher trophic levels, which in turn can ripple up to affect fish, birds, and marine mammals. Changes in phytoplankton phenology have also been known to be linked to the collapse of crucial fisheries. With climate change altering ocean temperature, light availability, and nutrient supply, the seasonal cycles of phytoplankton are shifting. Monitoring these shifts can help scientists detect early warning signs of ecosystem change and inform sustainable marine management.
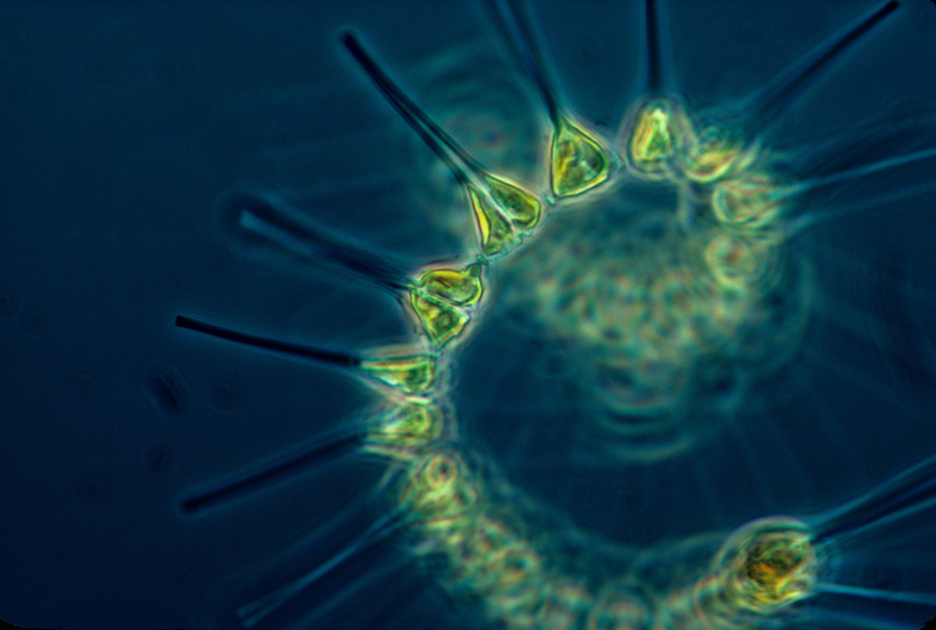
Phytoplankton are single celled plants that live in the sunlit surface oceans – This is an example of a chain-forming diatom (Credit: National Oceanic and Atmospheric Administration (NOAA))
Applications
This dataset supports a wide range of scientific, operational, and policy-relevant applications across global and regional scales, including:
- Detecting climate-driven shifts in phytoplankton phenology
Long-term trends in bloom timing and amplitude can reveal ecosystem responses to climate change. - Informing fisheries and conservation planning
Changes in phenology can affect trophic match–mismatch dynamics, influencing the success of key fisheries and the health of marine species. - Benchmarking Earth system and ecosystem models
Phenology metrics provide important observational constraints for validating biogeochemical processes in Earth System Models (ESMs). - Tracking Ecosystem Change and Biodiversity
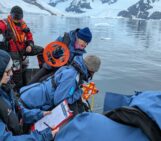
Tracking phenology metrics can help identify vulnerable regions, provide early warning of ecological shifts, and support biodiversity assessments through the mapping of seasonal bloom patterns. - Planning and interpreting oceanographic field campaigns
Aligning research campaigns with key phases of the phytoplankton growing season enhances the relevance and interpretability of in situ measurements. - Providing accessible tools for non-expert users
By offering pre-processed, user-friendly metrics across the globe, the dataset can support researchers and practitioners without advanced coding or high-performance computing resources.