To understand the fundamental behaviour of the ocean, and any changes it’s undergoing, we need to know what the ocean is doing today, and on each day in the recent past.
We can do this by creating reanalyses, which use data assimilation to combine state-of-the-art models with observations. The focus is often on ocean physics, but we also need to know about the marine ecosystem and carbon cycle.
As well as the best possible models and data assimilation schemes, reanalyses need the best possible observations. These don’t just need to be plentiful and accurate, but for many climate applications they must be treated consistently through time. This is to avoid introducing artificial trends and variability which would simply be due to changes in the observing system, rather than changes in the ocean.
One programme set up to address this need for consistency and stability is the European Space Agency Climate Change Initiative (ESA CCI). For a selection of Essential Climate Variables that can be observed from space, climate-quality datasets have been produced covering the satellite era, complete with uncertainty estimates. For the ocean, products were initially produced for sea surface temperature (SST), sea level, sea ice, and ocean colour. These have now been joined by sea surface salinity and sea state, and all products continue to be updated.
‘Climate from Space’ demo. Credit: ESA/Planetary Visions; music: “View of the Greenland Sea north of Siglufjörður, 2” by The Gateless Gate, CC BY-NC-ND 4.0
In a recent paper for Ocean Science, I explored the role each variable of the initial set of marine Essential Climate Variables plays when assimilated into a global physical-biogeochemical ocean reanalysis, and the consistency of features between different variables. This work was done as part of the Climate Change Initiative Climate Modelling User Group project, which brings together the Earth observation, climate modelling, and reanalysis communities, to ensure a focus on the climate system is at the heart of the Climate Change Initiative.
There is a curious and as-yet-unsolved problem in ocean data assimilation. Assimilating physics data, while highly successful in improving model physics, can result in spurious vertical mixing which degrades biogeochemical fields. I didn’t directly address this issue in my paper, but was able to show that despite this, assimilating satellite SST, sea level and sea ice could improve the representation of spatial features and variability in both physical and biogeochemical systems.

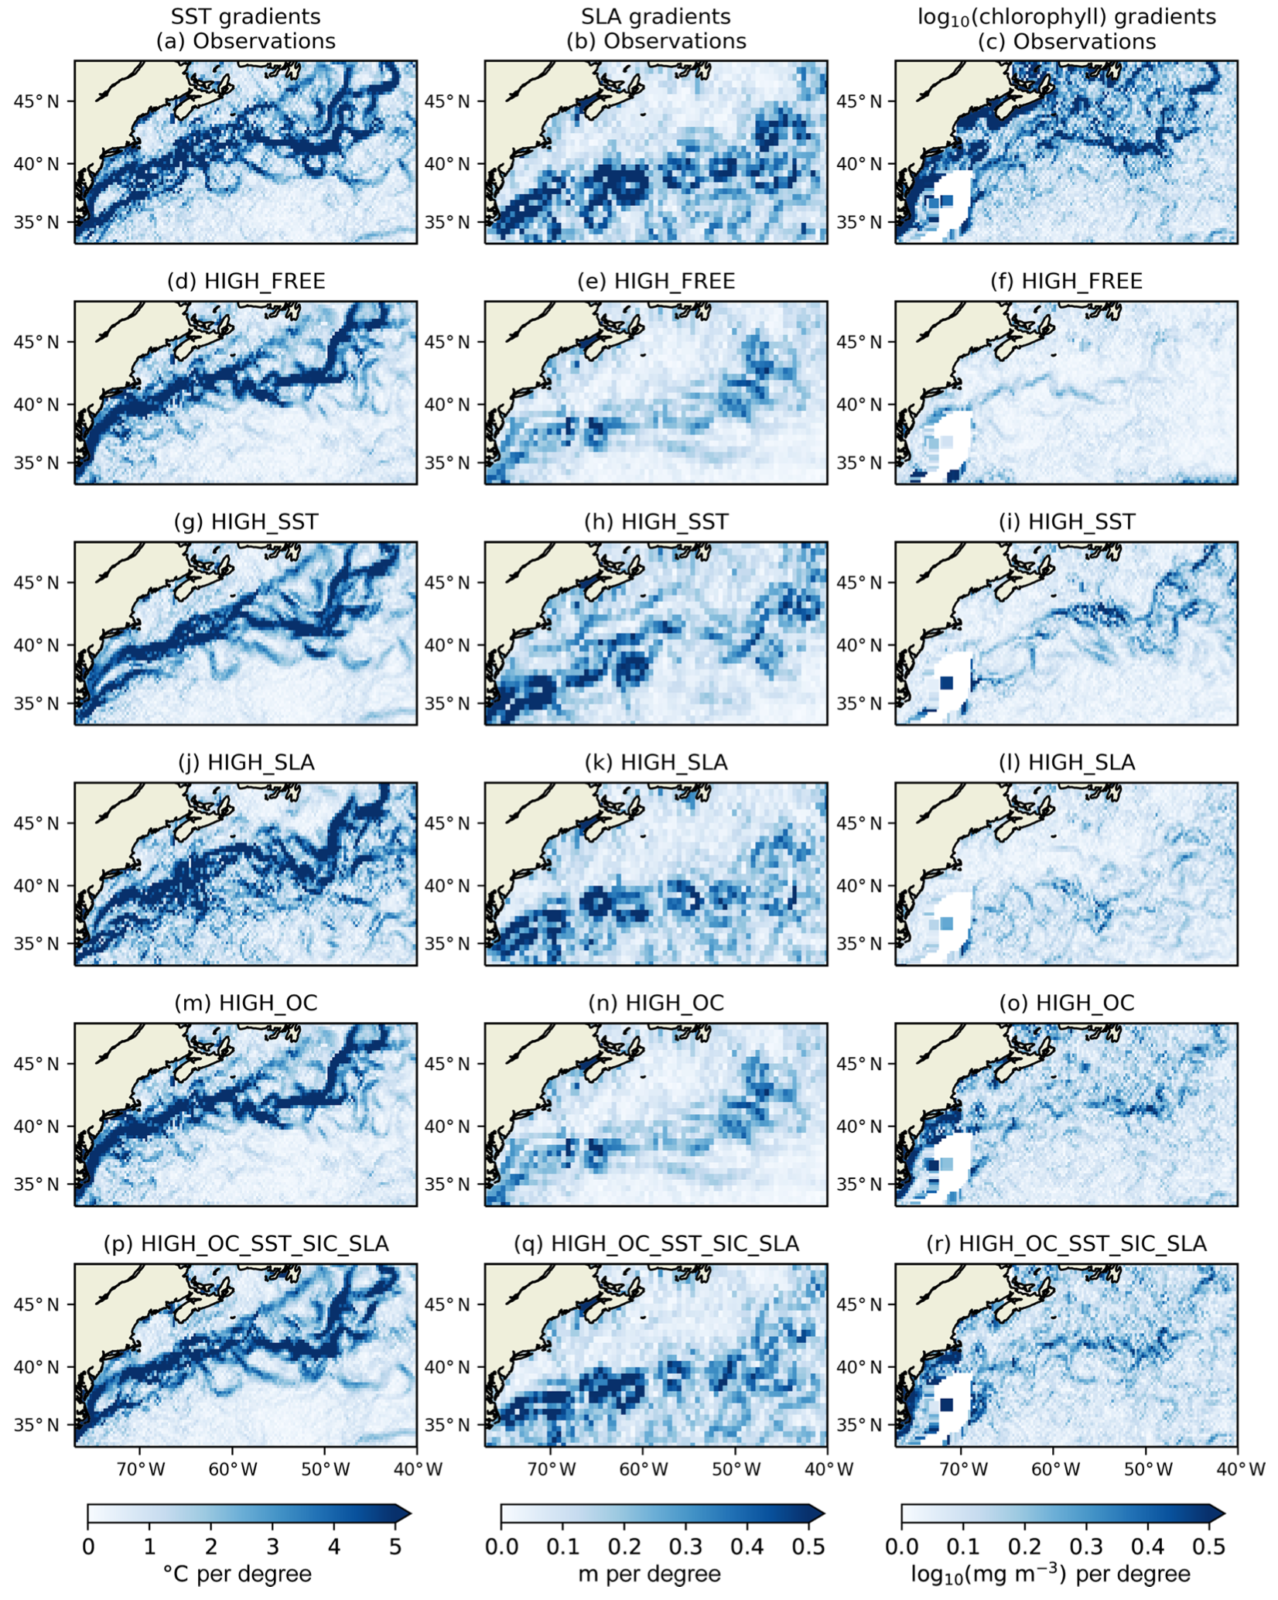
Horizontal gradients in the Gulf Stream region during December 2010, for SST (left column), sea level anomaly (middle column), and surface log10(chlorophyll) (right column). Calculated from satellite observations (a-c), a model with no data assimilation (d-f), assimilating SST (g-i), assimilating sea level (j-l), assimilating ocean colour (m-o), and assimilating SST, sea level, ocean colour, and sea ice (p-r). Credit: Ford (2020).
As an example, the above figure plots surface gradients of three variables in the Gulf Stream region: SST, sea level anomaly (SLA), and log10(chlorophyll). The top row shows the satellite observations. The remaining rows show a set of model runs assimilating those observations individually or in combination. This allows us to see the impact of assimilating each Essential Climate Variable on how the Gulf Stream is represented by different variables.
In the observation fields (a-c), fronts of SST and chlorophyll (obtained from ocean colour) are largely collocated, and situated around eddies identified in the sea level products. This gives confidence that the different Climate Change Initiative satellite products are giving a consistent view of the ocean surface.
In the model without data assimilation (d-f), gradients broadly match the observations, but some features are missing, and sea level anomaly and chlorophyll gradients are much too weak. Assimilating SST on its own (g-i) is enough to improve the position and magnitude of gradients in all three fields, demonstrating the wide potential of satellite observations for improving many aspects of ocean reanalyses. Assimilating sea level anomaly on its own (j-l) improves sea level anomaly gradients, with some improvement to SST and chlorophyll. Assimilating ocean colour (m-o) can’t affect the physics in this model, because the physics-biogeochemistry coupling is currently one-way, but clearly improves the ecosystem variables. But it’s when all the variables are assimilated together (p-r) that the best representation of the Gulf Stream is seen in all fields.
Satellite observations are clearly of great importance for climate research, especially when combined with models, but remain insufficient. In situ measurements of temperature and salinity are vital for simulating the ocean circulation, and many Essential Ocean Variables, particularly for biogeochemistry, simply cannot be measured from space.
New technologies such as Biogeochemical-Argo floats and gliders will further transform oceanography, and are already starting to be assimilated into reanalyses. This will help us better understand the impact of climate change and other stresses on the marine ecosystem, the challenges of ocean acidification and eutrophication, and the role of the marine carbon cycle in global climate.
Carbon dioxide ocean–atmosphere exchange. Credit: ESA/Planetary Visions
References & Further reading:
- Ford DA (2020) Assessing the role and consistency of satellite observation products in global physical-biogeochemical ocean reanalysis. Ocean Sci. doi:10.5194/os-16-875-2020
- Raghukumar K, Edwards CA, Goebel NL, Broquet G, Veneziani M, Moore AM, Zehr JP (2015) Impact of assimilating physical oceanographic data on modeled ecosystem dynamics in the California Current System. Prog Oceanogr. doi:10.1016/j.pocean.2015.01.004
- Verdy A, Mazloff MR (2017) A data assimilating model for estimating Southern Ocean biogeochemistry. J Geophys Res Ocean. doi:10.1002/2016JC012650
- Climate from Space
- Essential Ocean Variables
- Copernicus Sentinel-3
- Research programmes at the Met Office
- OS Behind the Research Story about the deployment of Argo floats and gliders:
Eurec4a: Tales from the Tropics
Edited by Meriel Bittner
