A question with no single answer
Imagine you are responsible for the water supply of a small town in the hills. Your wells tap groundwater, fed by rain and snowmelt seeping slowly through soil and rock. One day the town council asks a simple question: Will there still be enough water in August, fifty years from now?
Science can answer, but it gives about twenty answers, and they do not all agree. Some say your groundwater will be fine; others say summers will become much drier. Which one should you plan for?
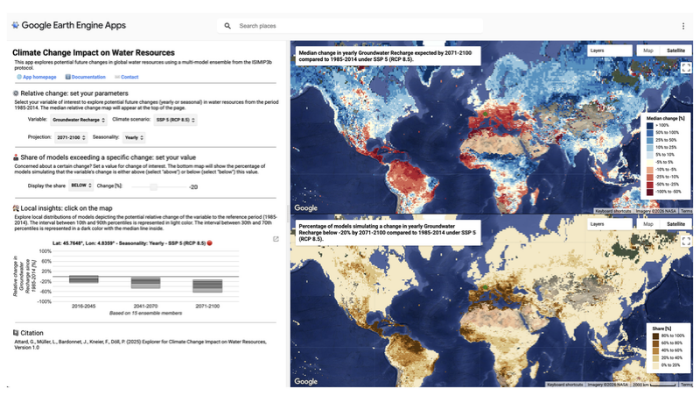
That question is at the heart of our new paper, just published in the open-access journal Geoscience Communication. We built a free online tool, the Climate Change Impact on Water Resources Explorer, that shows not only a middle-of-the-road projection of future water resources for any land area on Earth, but the full range of plausible futures. Its aim is to let you decide how much water risk you are willing to take.
Why the future of water is uncertain
Future water depends on three uncertain links: how much greenhouse gas we emit, how the climate responds, and how rivers and groundwater respond to that climate. Models capture these links differently, and no one knows in advance which is “right”. So scientists run many combinations and treat each as an equally plausible future.
The Explorer uses openly shared results from the Inter-Sectoral Impact Model Intercomparison Project: four global hydrological models driven by five climate models, giving 20 futures for each emissions pathway, in squares of about 55 by 55 kilometres.
Beyond the average
Most climate impact maps show one number per place: the median, or middle value, of all the models. It is a useful summary, but it can hide danger. A place where the median says “slightly wetter” may still have several futures that say “much drier”.
The Explorer therefore pairs two maps. The top one shows the median change in renewable water resources, groundwater recharge or evapotranspiration. The bottom one shows what share of the futures projects a change beyond a threshold that you consider a problem.
In southern Africa, the median projects more water over much of the region by mid-century. Yet in parts of southern Tanzania, more than one in five futures project a decline of over 25% (Figure 1).
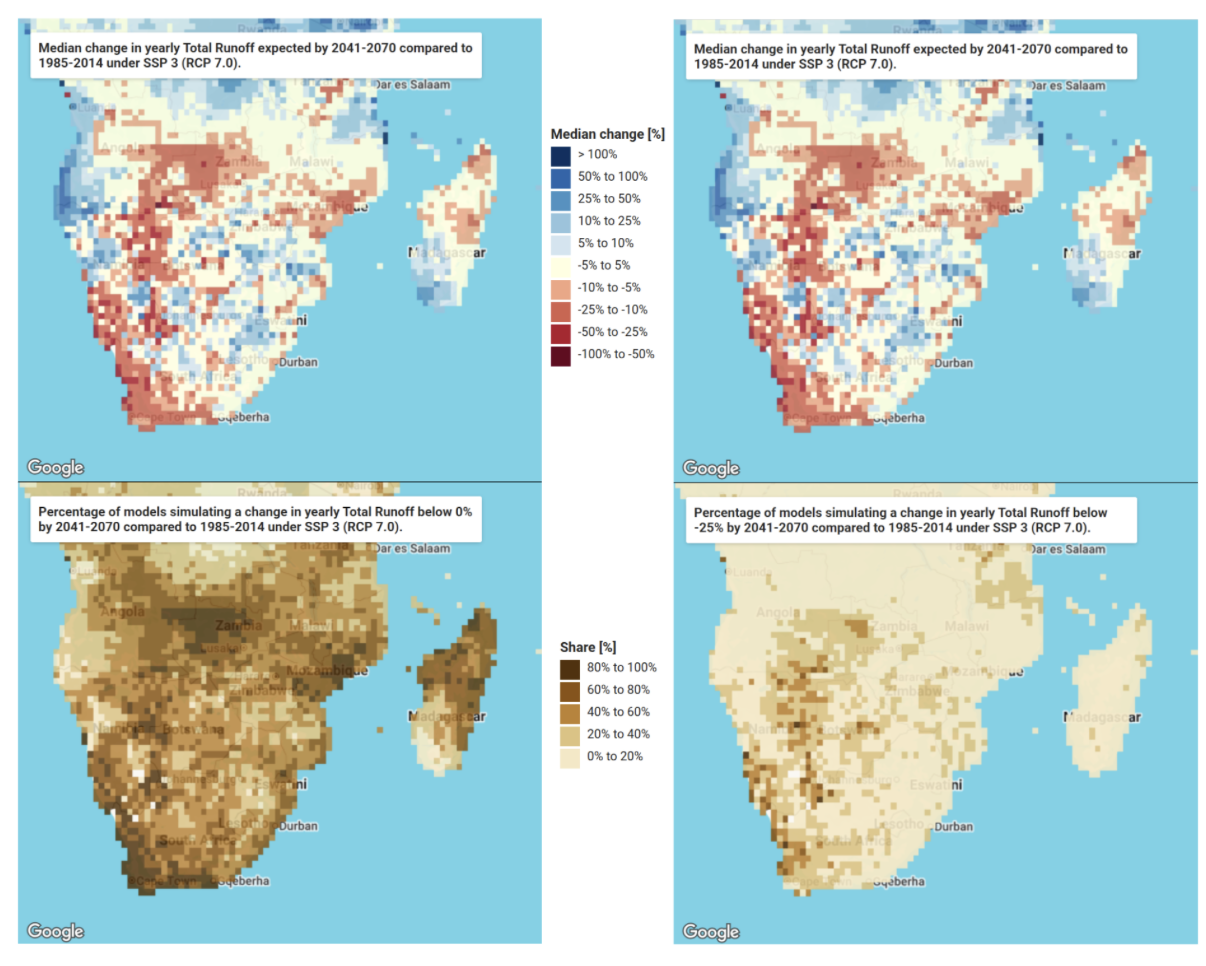
Figure 1. Southern Africa, 2041 – 2070, high-emissions pathway. Top: median change in renewable water resources. Bottom: share of futures projecting any decrease (left) or a drop of at least 25% (right). Döll et al. (2026), CC BY 4.0; map data © 2026 Google.
This is where risk comes in. A community that has just lived through a severe drought may want to prepare for any decline that even one future in ten considers possible; others may plan around the middle. Neither choice is wrong, but it should be made knowingly. The share of futures is not a true probability, but it is an approximate measure of how plausible a hazardous change is.
Zooming in on one place
Clicking on the map opens “Local Insights”, which summarises all the futures for that square as percentile boxes (Figure 2). Each box spans the middle 80% of the futures, leaving out the most extreme tenth at each end, and its central line marks the median.
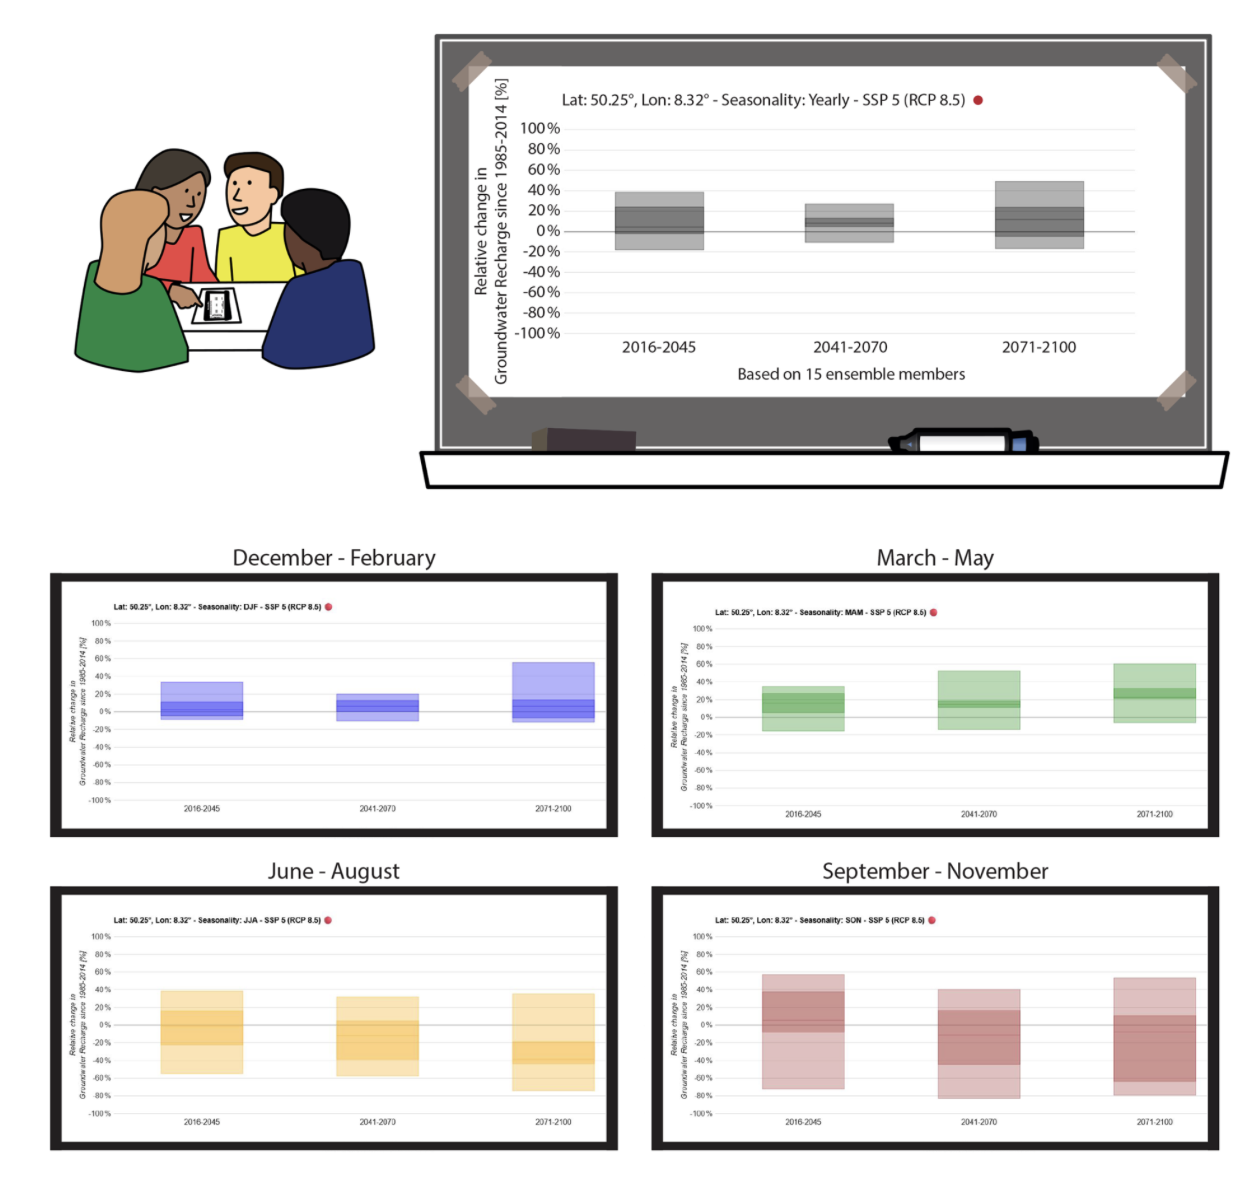
Figure 2. Change in groundwater recharge near Waldems, Germany, under a very high emissions pathway: whole year (top) and by season. Adapted from Döll et al. (2026), CC BY 4.0.
Near Waldems, north of Frankfurt in Germany, most futures project more groundwater recharge over the year. The seasons tell another story: by the end of the century, almost a third of the futures project summer recharge falling by more than 40%. For a waterworks relying on a small aquifer, those dry summers matter far more than the annual total.
Uncertainty travels best with a guide
Our pilot users and earlier workshops with local stakeholders taught us the same lesson: this information is most powerful when someone helps translate it. Once people understood that the median is not the “most likely” future, the conversation shifted from which projection is right to which futures they want to be ready for. A hydrologist or local climate manager can prepare the maps, then explain them in plain sentences such as “one in ten futures projects a decline of more than 20%”.
Try it yourself
The Explorer runs on Google Earth Engine in any web browser, free and without login. Start with the short tutorial, then click on a place you know. If you prefer the numbers, the full dataset is openly available on Source Cooperative, in a cloud-ready format with ready-to-run Python examples that rebuild the Explorer’s maps and percentile boxes.
Edited by Christina Orieschnig
A note from the editorial team: This is a guest blogger contribution received following a recent innovation in the Copernicus Publishing System: upon acceptance of your paper in one of our journals, authors are invited to consider if they would like to turn their science paper into a blog post.