Thermobarometry: a bit of background
Being able to understand the eruptive style of a volcano, how the eruptive behavior can evolve over time and managing to better interpret the signals that a volcanic system gives us before an eruption are of fundamental importance for mitigating the risk associated with eruptive activities.
In this context, it is extremely important to understand trans-crustal processes, in other words, the processes that take place deep within the magma chamber and the volcano plumbing system before and during eruptive activities.
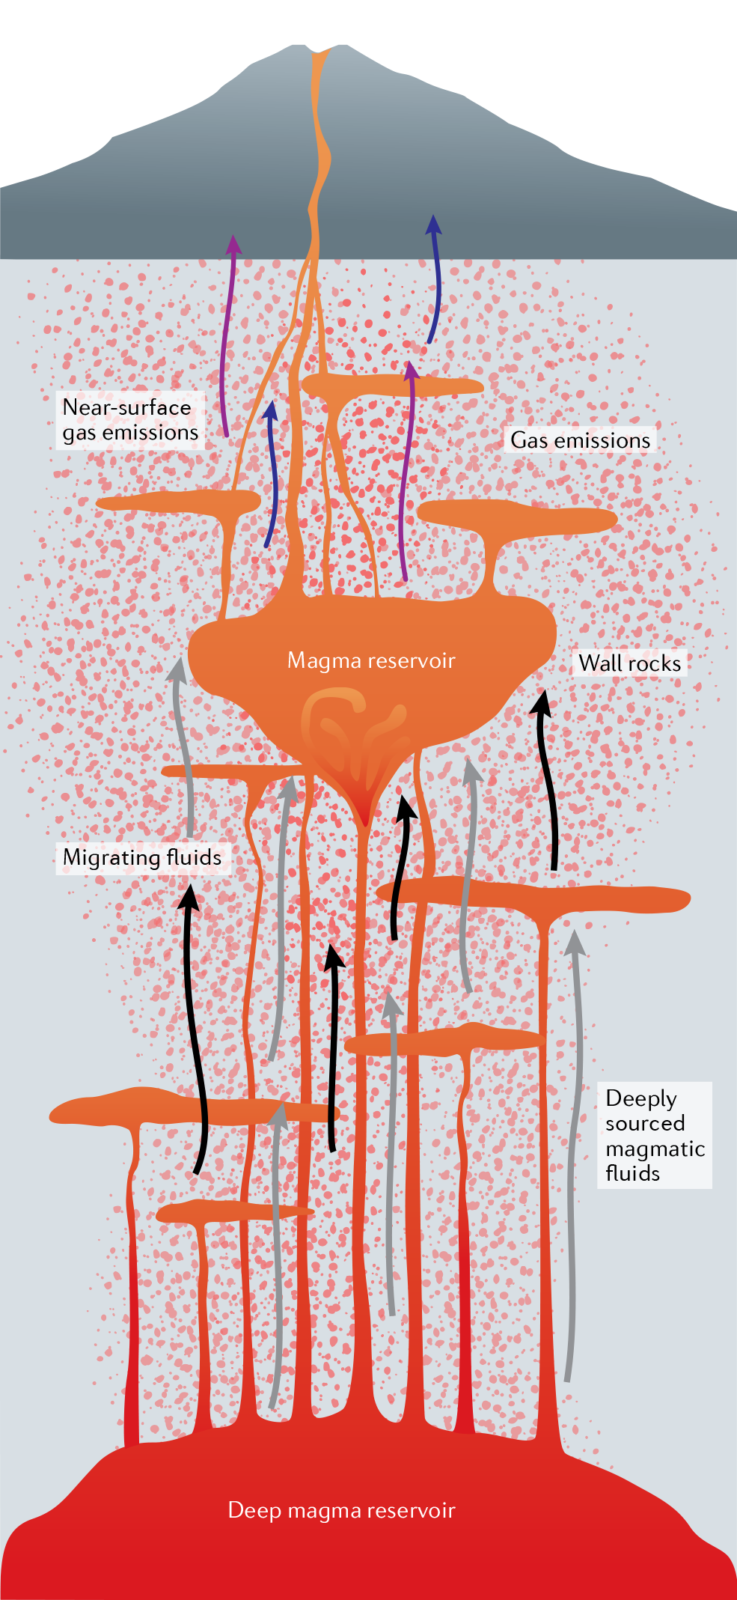
Figure 1 – A sketch of a volcanic plumbing system from Caricchi et al 2021.
But unfortunately understanding processes occurring deep below the earth surface it is not an easy job. We are unable to see with our own eyes what happens at these inaccessible depths. Magma chambers are very complex areas, they present thermal, physical and chemical gradients, and they are also dynamic! Therefore, the physical and chemical properties change over time (Caricchi and Blundy 2015; Cashman et al., 2017, Laumonier et al., 2017).
A multidisciplinary approach, combining different branches of geology, is therefore required to understand deep processes and in this framework the study of volcanic crystals is of key importance (Huang et al. 2015; Caricchi and Blundy 2015).
The chemical composition of crystals in fact reflects the physical and chemical properties at which they were formed, and variations in this chemistry can give us information about the processes that crystals underwent during their life up to the moment of eruption (Cashman & Blundy 2013, Cheng et al 2017, Caricchi et al., 2020; Weber et al., 2020).
Over the years, several methods have been developed that allow us to understand the temperature (T) and pressure (P) conditions under which the crystals formed. The determination of the T-P conditions at which minerals are formed is called thermobarometry (Powell & Holland, 2008, Putirka 2008; Mollo et al. 2015; Jorgenson et al. 2022). The application of machine learning techniques to geological problems has also recently proved very useful in estimating the conditions under which crystals formed (Petrelli et al. 2020; Higgins et al. 2022; Jorgenson et al. 2022).
Today we have the pleasure of interviewing Corin Jorgenson, a PhD student in petrology and volcanology at the University of Geneva, who has developed a thermobarometer based on the Random Forest algorithms.
Diving into the heart of thermobarometry with Corin Jorgenson
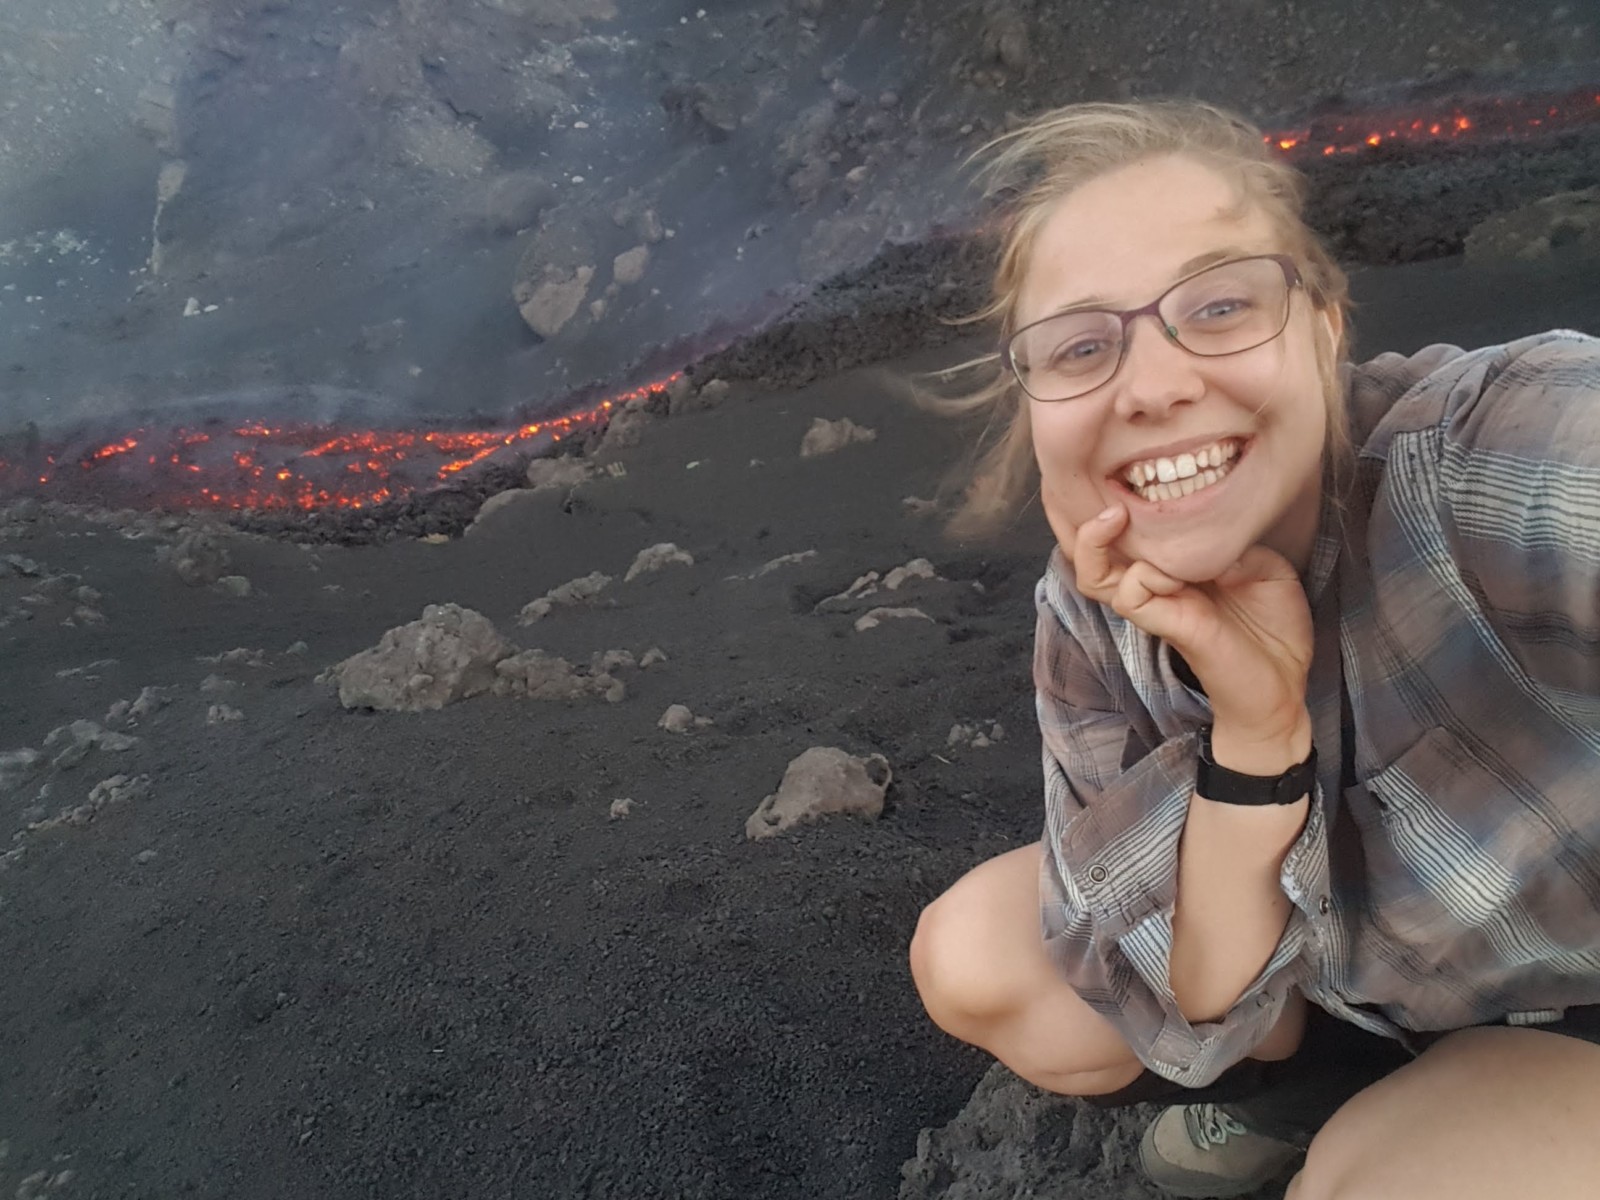
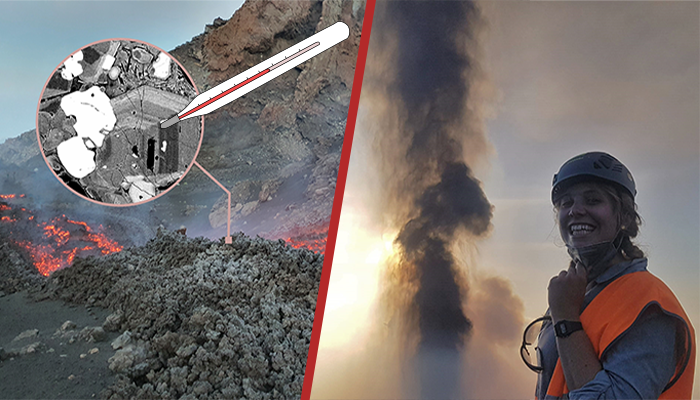
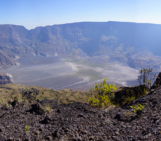
Figure 2 – A picture of Corin Jorgenson on the field, close to a runny lava flow on Mt. Etna, 2022
Hi Corin, thanks for being here with us today! before we start delving into the forests of machine learning I wanted to start with some more general questions. What is a thermobarometer? how many thermobarometers exist? and most importantly, how do they work?
Hi Alessandro, thanks for having me here! So thermobarometry is just the study of pressure and temperature. I look specifically at mineral thermobarometers, well specifically clinopyroxene, which is a mineral commonly found in volcanic systems, especially mafic ones. There are many thermobarometers out there, I don’t know the exact number but there has been lots of work over the years in this field. On a structural level this works because minerals have a defined mineral structure with different sites that elements inhabit. The volume of these sites changes as a function of pressure and temperature (which makes sense if you recall the ideal gas law!). So, for example at a higher pressure the volume of one of these sites decreases and so smaller elements will be preferentially incorporated. That’s the idea in principle! Of course, mineral systems are more complicated than that, which is why there is so much work looking into this!
In the introduction, I tried to give a general context to the subject, but to get more specific, what contribution can information from thermobarometry make to the study of volcanic systems and why?
Well, Thermobarometry can work in igneous and metamorphic systems too, but I think it’s most interesting in volcanic systems (but I’m of course a bit biased since I think volcanic are the most interesting rocks… 😊). But the idea is that you can use pressure as a proxy for depth and then you can get the idea of where the mineral crystallized in the crust and at what temperature conditions. Now we can use this to track the magma movement in the crust, if you have crystals where the core gives deep pressures, and the rims give shallow pressures you can draw conclusions about the magma moving to the surface. Now this is even more powerful if you have samples in stratigraphic succession – this can tell you even more about how the magmatic system evolved over time. The hope truly is that this information can aid us in understanding what triggers the eruption! Understanding how past volcanic eruptions happened helps to guide present day monitoring of volcanic systems.
In the past few years, you have developed a thermobarometer based on random forest algorithms, what is it and how does it work?
Well, Maurizio Petrelli and his co-authors initially wrote a paper in 2020 looking at different machine learning methods applied to cpx thermobarometry. Me and the rest of my lab group started using this but each of us was doing something a bit differently… I was using like 10000 trees and some people were using 100, we were using different elements and calculating the error differently! We realized that we need to come up with a method that we can all use as a guide so when we have data to compare, we can be sure we are comparing the data differences and not differences in our methodology!
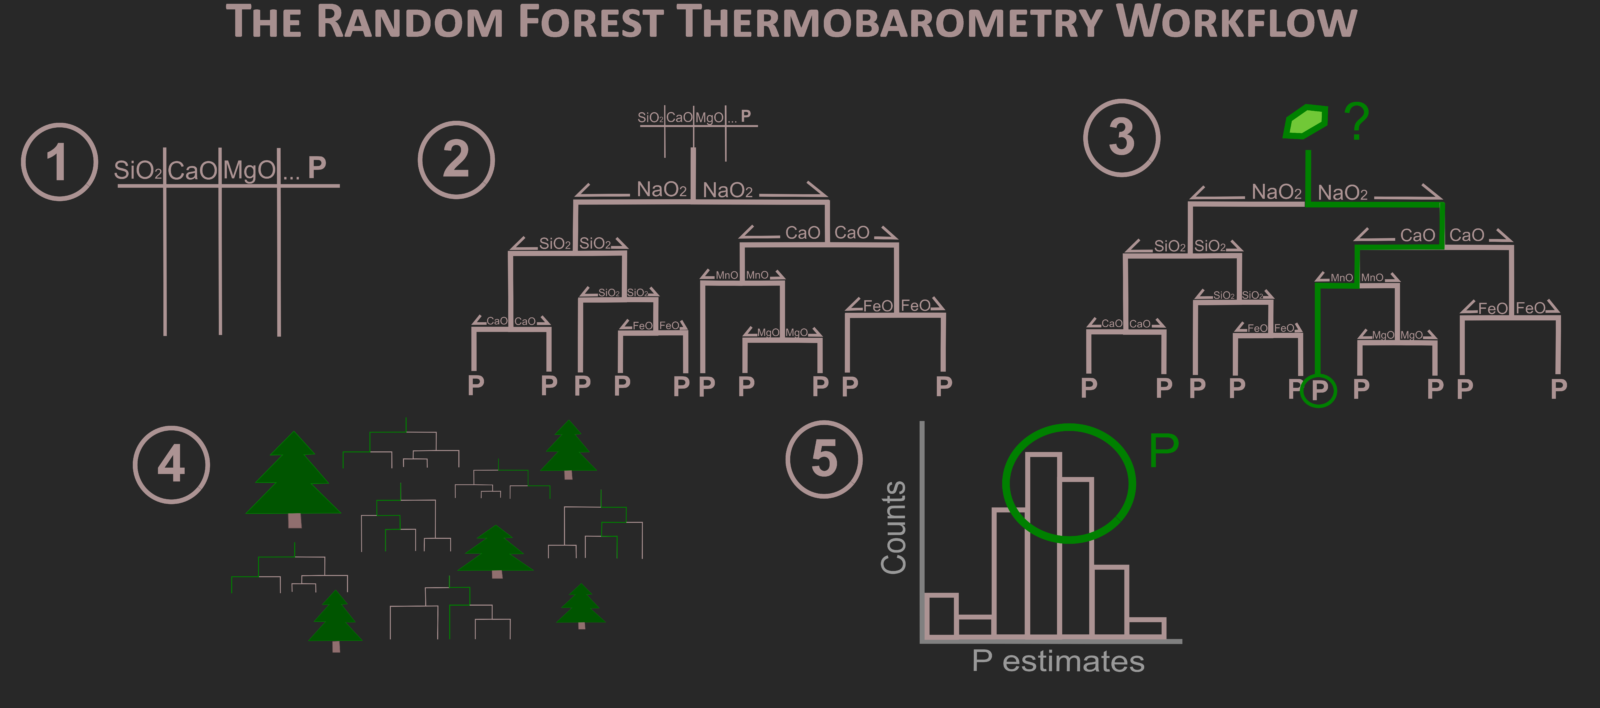
Figure 3 – This diagram shows a simplified version of how random forest works! Step 1) you must start with a dataset that you calibrate the model on. In our case this is a dataset of experimentally derived cpx, collected from the literature. These are made in a lab with known pressure and temperature. Step 2) Make a decision tree with this dataset! Essentially this is just splitting the dataset several times on the basis of mineral chemistry until you cannot split it anymore, making a series of branches. The end of these branches has the leaves, which is the P or T estimate. Step 3) Now with the decision tree we can apply a natural crystal to the tree! It follows a path through the tree until it arrives at a leaf – and gets a pressure or temperature estimate! Step 4) Splitting the dataset different ways creates different trees and can result in different results! So we make a forest of decision trees! Step 5) We can use the estimates from all the trees to find the best estimate!
Okay, so how does this work? Well essentially you give the algorithm a dataset and tell it to make a model that predicts pressure and temperature. So, our dataset, the calibration dataset as I call it, is a dataset of experimental clinopyroxenes. These are cpx crystals that are made in a lab setting with a well-defined pressure and temperature of crystallization. The algorithm takes this dataset, and it learns how to predict pressure and temperature by making decision trees. Decision trees are like hierarchical flowcharts. You may have seen one of these in a magazine once that had you answer a series of yes or no questions that lead you to the answer of what you should have for lunch (tacos, always tacos). Anyways in our decision trees instead of asking yes and no questions we split the dataset on the basis of mineral chemistry. So, for example, everything with say 60 wt. % SiO2 goes to the left and everything else goes to the right. Then you could split at say 4 wt.% MgO, then FeO, then CaO etc. Which element you choose and where you make the split is somewhat random, which is where the random in the random forest comes from. You just keep splitting and splitting the dataset till you cannot split anymore and you take that final datapoint’s pressure as the estimate. Then you can apply a mineral with an unknown P and follow through the decision tree to get a pressure estimate. However, if you split the dataset at SiO2 first versus MnO you are going to get a very different looking tree… this is why it’s a random forest. A forest comprised of many decision trees. From there you can take all these pressure estimates and determine the pressure from that. We found using the median of all these estimates is what works best and gives the smallest error.
What are the advantages of using this method?
Well, for me the big draw of this model is that I can use it for the uncommon magma compositions (mafic and alkaline) that I research for my PhD! But aside from its wide range of compositions it can work for, at the fundamental base it’s a data driven model. This means we are truly just looking at what the data is saying, with minimal prior assumptions! We also have a few other features that I think are really cool! We have implemented using a post model filtering mechanism that I think is really useful. From the distribution of the pressure (or temperature!) estimates we can get a density curve and calculate the interquartile region (IQR) from this. You can think of the IQR as a confidence interval, it’s basically telling you how confident the model is in its estimate. I like to use this as a post filtering, so anything with a IQR higher than 7 kbar I remove since I’m not very confident in the estimates. You can also use the IQR for each individual point plotted as error bars on graphs to show a better representation of where the crystallization is. Additionally, our model can work for cpx-only or cpx-melt pairs. The entire code is open source and available here. We have two versions one is the “Plug and Play” version which you really only need to plug in your data and then you get estimates. We also have the “Choose Your Own Adventure” version where you make the model yourself. This version allows users to change the model to how they see fit. For example, if they are missing an element, they can adjust for this and make an updated model. We can also improve our model as we go – as more data gets added in the literature, we can easily add that to our model and improve!
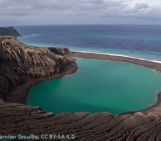
I also know that you have a paper in preparation regarding the application of the random forest thermobarometry to a very interesting European volcanic area, the Colli Albani volcano, in Italy. What makes this volcano interesting? What information did the application of the random forest thermobarometry gives you about the processes that led to the eruptions of this volcanic system?
Yeah, so Colli Albani is a really cool volcano in central Italy – it’s just 20 km SE of Rome. In the past (thousands of years ago) Colli Albani has created these massive and very violent eruptions, with a volcanic explosivity index (VEI) of 6-7 (comparable to the 1991 eruption of Pinatubo!). In the field there are these thick ignimbrite deposits which means there were pyroclastic flows which you get from really explosive events. But the interesting thing is Colli Albani has magma that should make runny lava flows… Colli Albani is mafic (low SiO2) AND alkaline (high Na and K) which should mean low viscosity, runny, not making VEI6 eruption lava. So, what gives? What has happened here? Well, one way to consider this is to use the thermobarometry to take a look where the magma has come from. When we apply the thermobarometer to the cpx from Colli for the last ignimbrite forming event (called Villa Senni, VSN) we see most of the cpx are in the shallow crust, from 3-10 km more or less. Now this is pretty good, since this fits with the proposed magmatic reservoir which Bianchi et al (2008) suggests from present day geophysical evidence! However, there is a bit of a disconnect between these estimates and some of our cpx which are high in Cr2O3 and Mg# – which suggests they came from magma that was in equilibrium with the mantle… but obviously the mantle is not at 3-10km depth in Italy! So, we suggest that this means that this magma had to come up without crystallizing and stall in this shallow reservoir. We can see in the thermal history of the crystals that this work. We have a wide range in temperatures from cold to hot. We suggest that magma comes up from depth and stalls here… but one of these pulses is the final straw and tips the reservoir out of equilibrium and into an eruptive phase. That’s all I’ll say for now though since it’s a work in progress! If you want to know more, I’ll have a pre-print out sometime in the near future. You can follow me on research gate or twitter to keep update about this research and also about the random forest thermobarometer.
References
- Bianchi, I., Piana Agostinetti, N., De Gori, P., & Chiarabba, C. (2008). Deep structure of the Colli Albani volcanic district (central Italy) from receiver functions analysis. Journal of Geophysical Research: Solid Earth, 113(B9).
- Caricchi, L., & Blundy, J. (2015). Experimental petrology of monotonous intermediate magmas. Geological Society, London, Special Publications, 422(1), 105-130.
- Caricchi, L., Petrelli, M., Bali, E., Sheldrake, T., Pioli, L., & Simpson, G. (2020). A Data Driven Approach to Investigate the Chemical Variability of Clinopyroxenes From the 2014–2015 Holuhraun–Bárdarbunga Eruption (Iceland). Frontiers in Earth Science, 8, 18.
- Caricchi, L., Townsend, M., Rivalta, E., & Namiki, A. (2021). The build-up and triggers of volcanic eruptions. Nature Reviews Earth & Environment, 2(7), 458-476.
- Cashman, K., & Blundy, J. (2013). Petrological cannibalism: the chemical and textural consequences of incremental magma body growth. Contributions to Minerv alogy and Petrology, 166(3), 703-729.
- Cashman, K. V., Sparks, R. S. J., & Blundy, J. D. (2017). Vertically extensive and unstable magmatic systems: a unified view of igneous processes. Science, 355(6331), eaag3055.
- Cheng, L., Costa, F., & Carniel, R. (2017). Unraveling the presence of multiple plagioclase populations and identification of representative two-dimensional sections using a statistical and numerical approach. American Mineralogist, 102(9), 1894-1905.
- Higgins O, Sheldrake T, Caricchi L (2022) Machine learning thermobarometry and chemometry using amphibole and clinopyroxene: a window into the roots of an arc volcano (Mount Liamuiga, Saint Kitts). Contributions to Mineralogy and Petrology 177:1–22
- Huang, H. H., Lin, F. C., Schmandt, B., Farrell, J., Smith, R. B., & Tsai, V. C. (2015). The Yellowstone magmatic system from the mantle plume to the upper crust. Science, 348(6236), 773-776.
- Jorgenson C, Higgins O, Petrelli M, et al (2022) A Machine Learning‐Based Approach to Clinopyroxene Thermobarometry: Model Optimization and Distribution for Use in Earth Sciences. Journal of Geophysical Research: Solid Earth 127:e2021JB022904
- Mollo S, Giacomoni PP, Andronico D, Scarlato P (2015) Clinopyroxene and titanomagnetite cation redistributions at Mt. Etna volcano (Sicily, Italy): footprints of the final solidification history of lava fountains and lava flows. Chemical Geology 406:45–54
- Laumonier, M., Gaillard, F., Muir, D., Blundy, J. & Unsworth, M. Giant magmatic water reservoirs at mid-crustal depth inferred from electrical conductivity and the growth of the continental crust. Earth and Planetary Science Letters 457, 173–180 (2017).
- Petrelli M, Caricchi L, Perugini D (2020) Machine learning thermo‐barometry: Application to clinopyroxene‐bearing magmas. Journal of Geophysical Research: Solid Earth 125:e2020JB020130
- Powell, R., & Holland, T. J. B. (2008). On thermobarometry. Journal of Metamorphic Geology, 26(2), 155-179.
- Putirka KD (2008) Thermometers and barometers for volcanic systems. Reviews in mineralogy and geochemistry 69:61–120
- Weber, G., Caricchi, L., Arce, J. L., & Schmitt, A. K. (2020). Determining the current size and state of subvolcanic magma reservoirs. Nature Communications, 11(1), 1-14.
Victoria Corcimaru
Great article!!!! Loved it!!!