We are visual learners after all and for many of us, creating visual content is far more out of our comfort zone than the already hard earned skills of writing itself. Still, creating an accessible image can be pivotal to not only the success of your paper, but also the reach of your science in general. Today’s post started with a climate figure that went viral because of its similarity to the ico ...[Read More]
You can’t unsee it – the impact of a good visual for scientific data
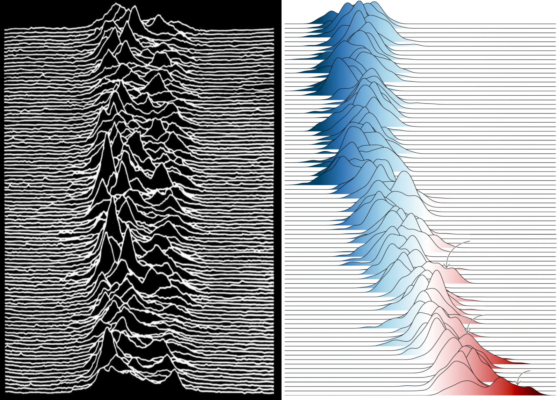
From iconic album cover of Joy Division to depicting relevant updates on annual temperature anomalies. The way we depict our data, impacts how far it will be seen. [Credit: image left from Joy Division album ‘Unknown Pleasures’ from 1979 & right ERA4, C3S/ECMWF; edited by Maria Scheel].