CR
Cryospheric Sciences

climate change

Marine Ice Sheet Instability “For Dummies”

Marine Ice Sheet Instability “For Dummies”
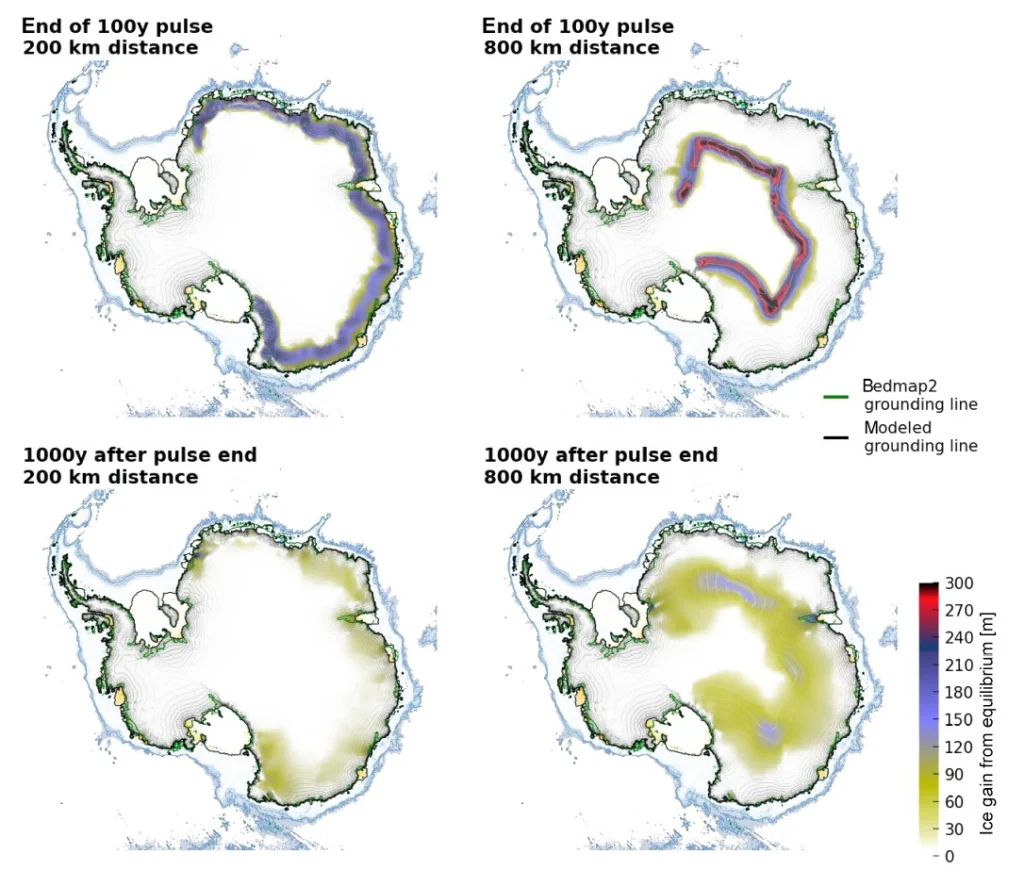
MISI is a term that is often thrown into dicussions and papers which talk about the contribution of Antarctica to sea-level rise but what does it actually mean and why do we care about it? MISI stands for Marine Ice Sheet Instability. In this article, we are going to attempt to explain this term to you …[Read More]

Image of the Week — Historical aerial imagery of Greenland

Image of the Week — Historical aerial imagery of Greenland

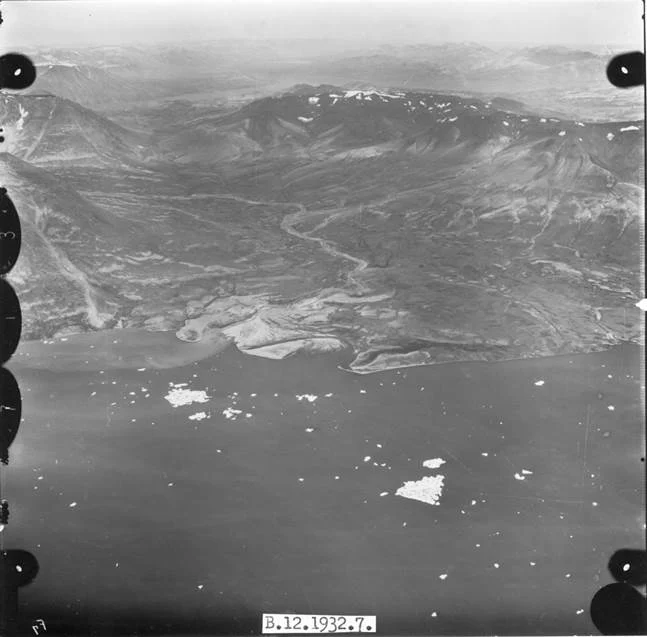
A few month ago, we were taking you on a trip back to Antarctic fieldwork 50 years ago, today we go back to Greenland during 1930s! When geopolitics serves cryospheric sciences The Permanent Court of International Justice in The Hague awarded Danish sovereignty over Greenland in 1933 and besides geopolitical interests, Denmark had a keen …[Read More]

Image of The Week – The Ice Your Eyes Can’t See!

Image of The Week – The Ice Your Eyes Can’t See!

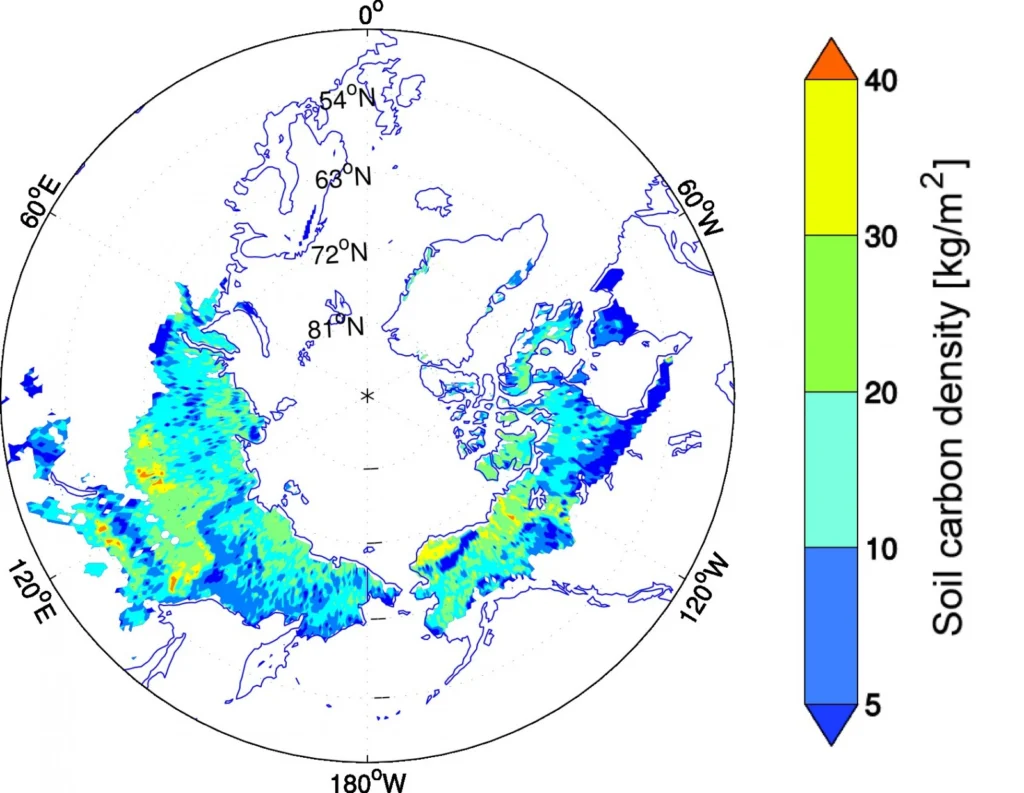
Ice sheets and glaciers are very visible and much photographed (e.g. here) elements of the Cryosphere but what about the vast, invisible and buried parts?  Around a quarter of the land in the Northern hemisphere remains frozen year round, making up a hugely important part of the cryosphere known as permafrost. Permafrost largely exists at high latitudes (e.g. Siberia and …[Read More]

Image of the Week: The Bipolar Seesaw

Image of the Week: The Bipolar Seesaw

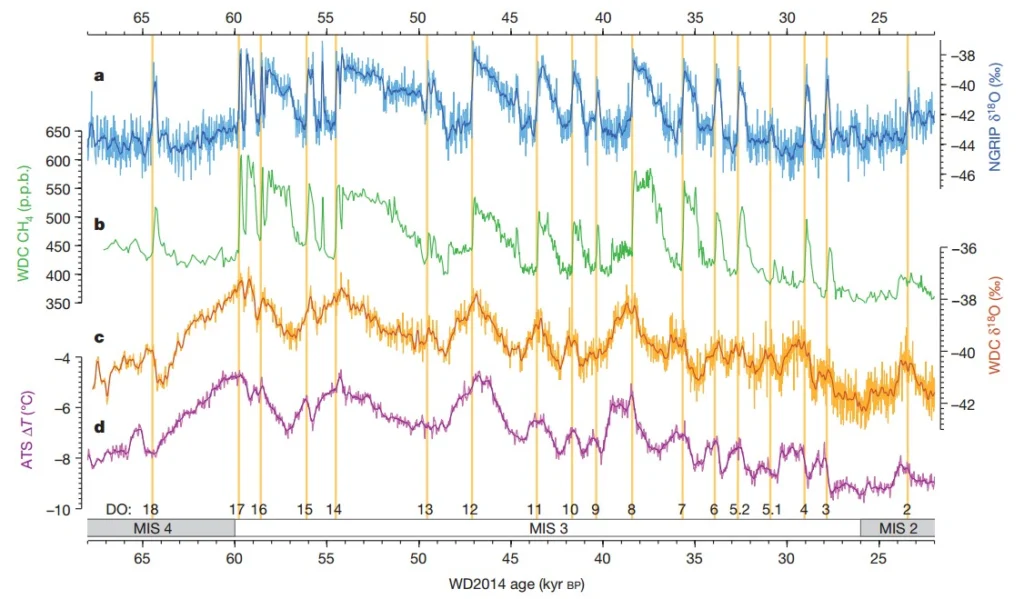
The colourful graphs above show how the climate changed in the period from 65 to 25 thousand years ago when Earth was experiencing an ice age. A wealth of information on the dynamics of our climate is embedded in the curves, especially how the northern and southern hemisphere interact, and how fast climate can change. …[Read More]

Image of the Week: Atmospheric CO2 from ice cores

Image of the Week: Atmospheric CO2 from ice cores

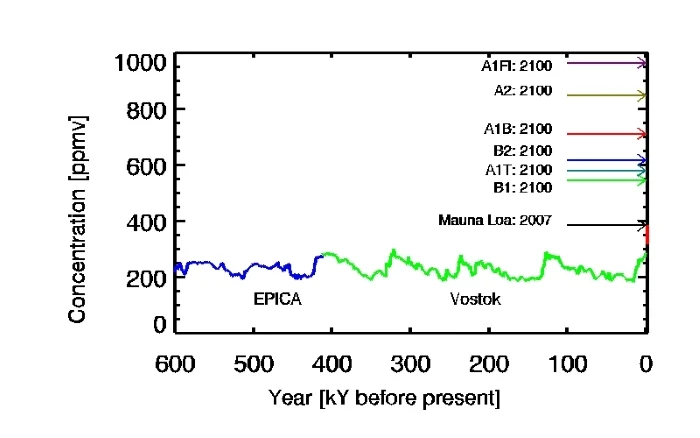
The measurements of atmospheric CO2 levels at Manu Loa, Hawaii read 401.01ppm on the 7th of December this year. To understand the significance of this number, you just need to look at the figure above from the 4th IPCC report. It shows the changes in CO2 concentrations during the past 800,000 years based on ice …[Read More]