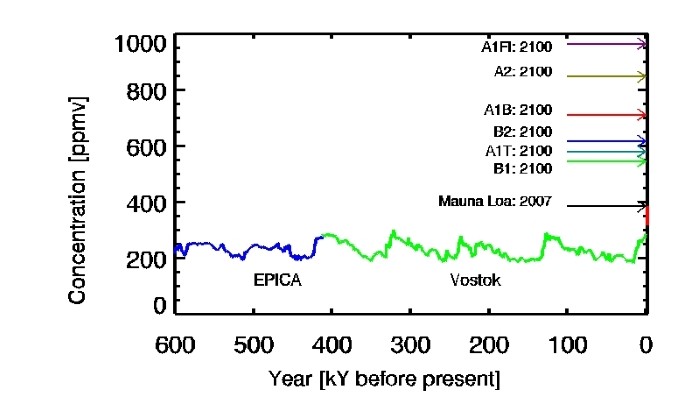
The colourful graphs above show how the climate changed in the period from 65 to 25 thousand years ago when Earth was experiencing an ice age. A wealth of information on the dynamics of our climate is embedded in the curves, especially how the northern and southern hemisphere interact, and how fast climate can change. The figure represents thousands and thousands of hours of work by scientists, te ...[Read More]
Image of the Week: The Bipolar Seesaw
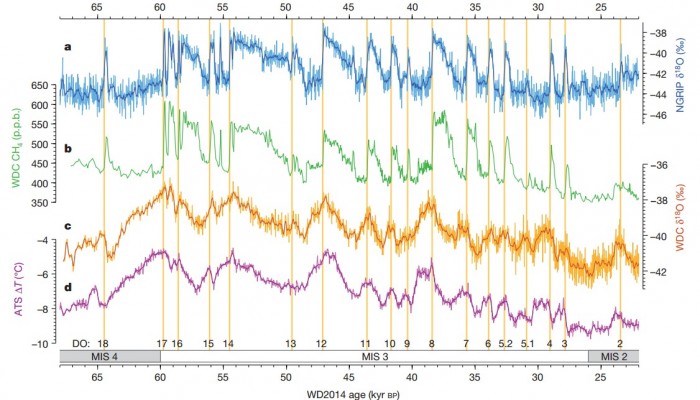
Ice core records from the WAIS core showing fast millennial-scale climatic variability. Reprinted by permission from Macmillan (Publishers Ltd: Nature, WAIS Divide Project Members, 2015, vol. 520).