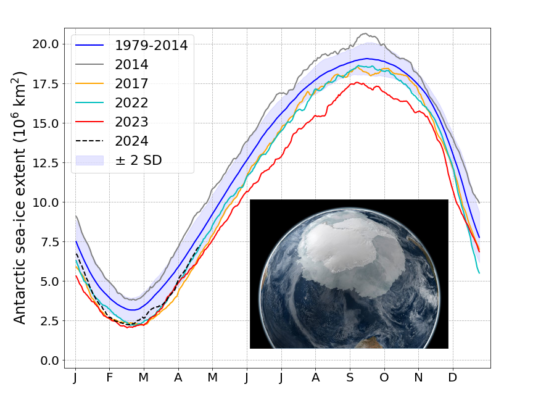
In November last year (see this post), we promised to provide you an update of what happened with Antarctic sea ice during the year 2023 – a year of an exceptionally low extent. In this post, we try our best to discuss the conditions that lead to (part of) the recent loss in Antarctic sea ice, including atmospheric and ocean processes. How sea ice usually works… One of the ways scientists h ...[Read More]
You thought it was over? Here’s more on the 2023 Antarctic sea-ice extent record low

Figure 1: Daily cycle of the Antarctic sea-ice extent (in million km²) for separate years featuring record lows (2017, 2022, 2023, 2024) and a record high (2014), and for the average over the 1979-2014 period. The blue shading indicates the interannual variability (2 standard deviations) around the 1979-2014 mean [Credit: D. Docquier, based on the OSI SAF sea-ice index, last access: 24/04/2024]. The map in the lower right corner shows the Antarctic Ice Sheet, as well as Antarctic sea ice surrounding it, in September 2005 [Credit: Wikimedia Commons, NASA Earth Observatory].
