What do you need to form sea ice? Well, you can start with some sea water, an ocean will do, and cold air above it. Once a layer of ice starts forming, break it to make some cracks. You would have not thought of that? Yet, our recent study suggests cracks in the ice contribute significantly to Arctic winter sea ice production.
A relationship between sea ice formation and breakup?
We have known for a while that sea ice is not a smooth, uniform, white cover on top of the Arctic and Antarctic oceans. It is full of cracks, generally called leads, that separate ice floes with sizes varying from a few metres to tens of kilometres. These leads are generally long (up to hundreds of kilometres) and narrow (from a few metres to a few kilometres). The reason for these cracks? Sea ice moves, constantly pushed by winds and ocean currents. Fridtjof Nansen proved it to the world in the 1890s by drifting onboard his ship, the “Fram”, moored on such an ice floe, from the north of Siberia to the Greenland Sea. When sea ice moves, it deforms, as it must flow through narrow straits and along irregular coastlines. For sea ice, deformation is a violent process. There is no choice – it must break. Crack!
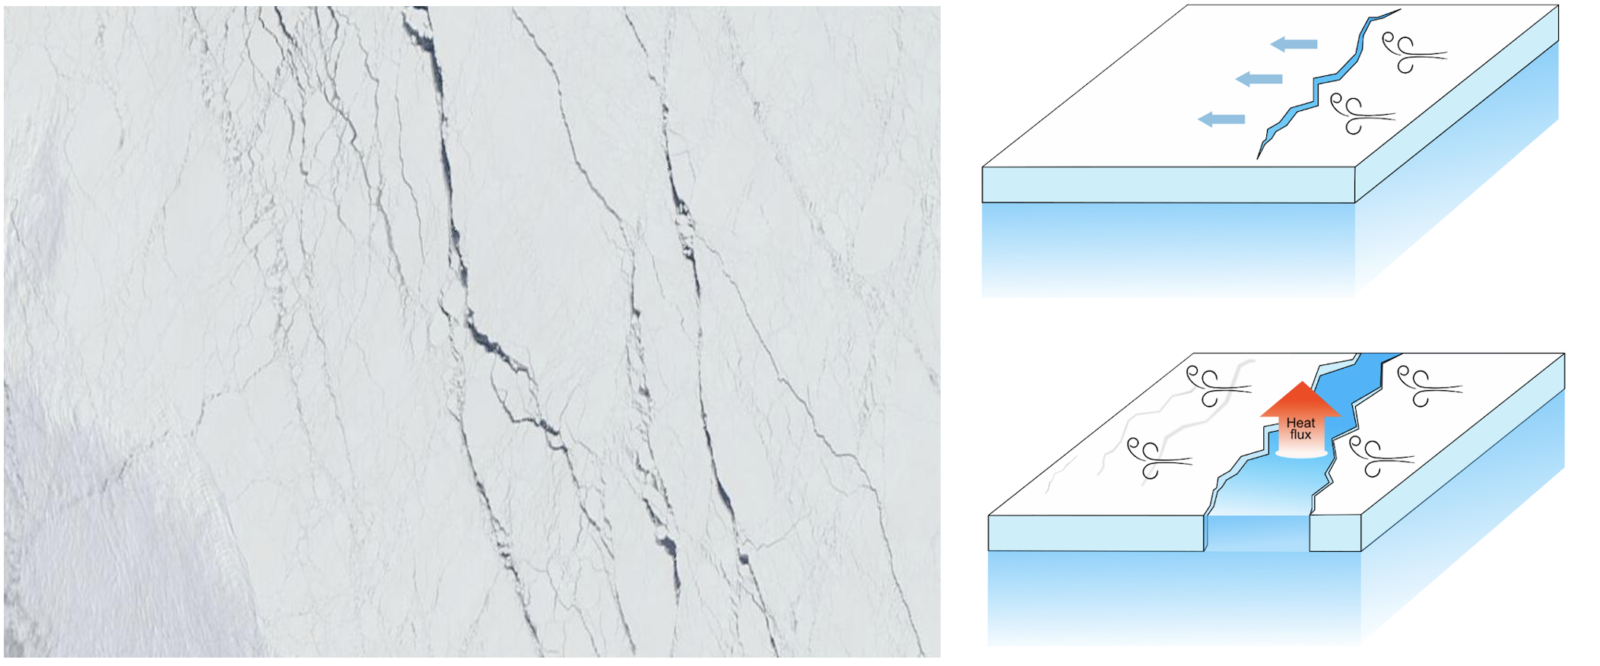
Figure 2. Left: Satellite (MODIS) image of sea ice in the Beaufort Sea, north of Canada (350×150 km). The leads appear as dark lines in the ice cover (NASA Worldview). Right: Schematic of the processes explaining ice formation in leads: ice leads open as ice breaks under the effects of winds, exposing the ocean to the cold atmosphere. Water loses heat, creating new ice. Credit: [J. Rheinlænder]
As the sea ice is broken, it can move. These moves often will create gaps, the leads (Figure 1 & 2). Now, how do these leads affect sea ice growth? Well, let’s first think about sea ice growth works: the ocean (~0oC) loses heat to a colder atmosphere (often below -10oC in the Arctic), the water temperature drops until ice forms, most of the sea salt is ejected and here you go, new sea ice for you! Easy. Now, what happens once the ocean is fully covered with sea ice? Then, the ice and snow layer on top of the ocean act like a blanket, isolating the ocean from the cold air and limiting the ice production. However, when sea ice breaks and leads form, it exposes the ocean again, and fosters new ice production. This new sea ice will grow until:
- The atmosphere stops being cold…
- Or the ice layer is thick enough to isolate the ocean from the cold air…
- Or the sea ice floes converge towards each other, closing the lead.
This mechanism of ice formation in leads is well-known, but a question remains: How important is it at the Arctic scale? Does it explain 1, 10, 50, or 80% of sea ice production every winter? Unfortunately, the few observations available do not allow us to answer this question, but numerical models may do the trick.
The challenge of breaking (modelled) sea ice
Bad news first: sea ice models are not good at reproducing sea ice leads. It is not impossible, but it may require some work on the sea ice rheology. Rheology is a complicated word to describe the mathematics we use to represent the way a solid medium, like sea ice, moves and deforms. The behaviours of glass, steel, and cheese for instance can all be described by a rheology, but as you may imagine these rheologies are not the same (and engineers should be careful to pick the right one). The rheology generally used in sea ice model since the 1980s does a very good job at reproducing large-scales motions and properties, like the sea ice extent and thickness. Unfortunately, they do not really capture very well how sea ice breaks, unless they are run at a very high resolution (<5 km), which requires a lot of computational power (=big computers and a lot of time). We tried to develop a model at the Nansen Center in Bergen (Norway) to do a better job when it comes to representing sea ice leads and after a few years – we made it! It is called neXtSIM and uses a rheology called Brittle-Bingham-Maxwell (Ólason et al., 2022).
Representing sea ice breakup is good, but not enough. To investigate the role of leads in ice production, we needed to make sure that ice production and volume is well represented in neXtSIM, too! That is the hard life of scientists, every time we develop a new tool to do one thing, we must demonstrate it can do as good as the “old tools” for all the other things. That’s why in our last study (Boutin et al., 2023), we spend a long time comparing observations of sea ice thickness, extent, drift, etc. with our simulation results. Fortunately, neXtSIM does a very decent job for all these metrics. Our model is ready!
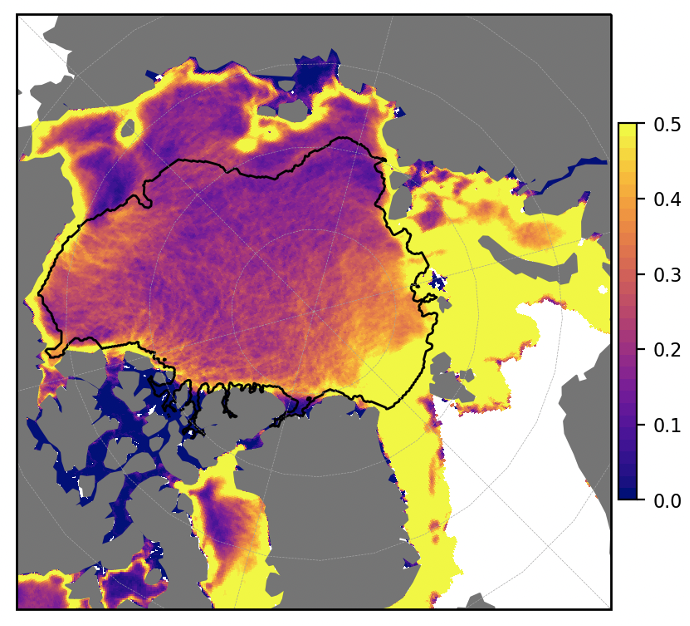
Figure 3. Left: 2000-2018 Ratio of (January to March) winter ice production in leads relatively to total ice production (that includes both ice formed in leads and ice that grows at the base of ice floes). Figure adapted from Boutin et al., 2023.
Estimation is a matter of definition
To estimate how much ice is produced in leads, we need to distinguish ice that grows in leads from ice that grows at the base of sea ice floes, which are the two main ways sea ice is produced. For that aim, we could define what a lead is in the model, but this is not so simple. For instance, a general definition of a lead is a long and narrow opening in the sea ice pack, but there is no consensus on how long and how narrow it should be to be considered a lead. Moreover, a choice of a definition would probably have a strong impact on our estimation, and such a method would require the development of a complex system to classify what is a lead and what is not in our results. However, it is very easy for a model to distinguish sea ice that grows in open water from sea ice that grows at the base of sea ice floes. Sea ice growth in open water happens either in leads or at the ice edge, where sea ice meets the open ocean. From January to March, the Arctic Basin is fully covered by sea ice, there is no ice edge. It means that open water only happens in this region and for this period when sea ice breaks up and forms new leads. Therefore, all the sea ice that grows in open water in this region and for this period is produced in leads. For that reason, we limited our estimation to the Arctic Basin (we define as the black contour in Figure 3) and the period from January to March for each year between 2000 and 2018. We no longer need to define individual leads in the model! Researchers are often running out of time and money, a simple approach like this has the advantage to save both and facilitates the reproduction of our analysis.
So how much ice comes from leads?
We now have a model, a simulation that does a good job with sea ice, and a method. We are all set up to look at our results! The first thing we checked was whether the impact of leads on sea ice production is significant over long-time scales. For that, we looked at the ratio of ice that grows in leads compared to the total amount of ice that is produced every winter, for 18 years of our simulation. And what we saw (Figure 3) was quite striking: even though leads are features that open and close over the course of a few days, their patterns are clearly visible over 18 years of ice production, particularly in the Beaufort Sea and north of the Fram Strait. This means two things:
- Yes, leads have a significant impact on sea ice production.
- The fact that their patterns are not smoothed out by the averaging suggests their location and shape must be strongly constrained by geographical features (such as ocean currents and coastlines).
If we average this ratio over our study area, we find that between 25 and 35% of the overall ice production takes place in leads alone. Finally, we get our answer! The good news is that this is consistent with previous estimates from observations. Interestingly, our model also suggests that this production seems to increase with time (+3% per decade). And we also have an idea why: As sea ice in the Arctic gets thinner, it becomes more sensitive to breakup, which could enhance lead formation and ice production, at least until further warming leads to a collapse of Arctic sea ice production. Confirming this hypothesis will require extending the analysed period and a more thorough evaluation of the model against observations. That will be our future work!
Further reading
Rheinlænder et al. (2022). “Driving Mechanisms of an Extreme Winter Sea Ice Breakup Event in the Beaufort Sea”. Geophysical Research Letters, 49(12), e2022GL099024. https://doi.org/10.1029/2022GL099024.
Willmes, Heinemann and Schnaase (in review, 2023) “Patterns of wintertime Arctic sea ice leads and their relation to winds and ocean currents, The Cryosphere Discuss. [preprint], https://doi.org/10.5194/tc-2023-22.
There are plenty of previous Cryoblog posts about: sea ice formation, Artic sea ice coverage, winter sea ice observations, sea ice microbes, the interaction between sea ice and the atmosphere, and the differences between Arctic and Antarctic sea ice.
Edited by Stefan “Zwiebel” Thiele and Maria Scheel
 Guillaume Boutin is an early-career researcher at the Nansen Environmental and Remote Sensing Center, Bergen, Norway. He investigates the physical interactions between sea ice and the ocean. He develops and uses numerical models, the sea ice model neXtSIM, to understand the processes behind the changes we observe in the Arctic Ocean. He tweets as @guiboutin. Contact Email: Guillaume.boutin@nersc.no