We usually think of a glacier as a white, clean surface. Well, this is only an idealized vision because in reality glaciers are far from immaculate, they can be colored! And this is extremely important since colored (dirty) ice absorbs more solar radiation than clean ice, accelerating melt. One of the places on Earth where it is fundamental to understand these processes is Greenland, where ice is getting darker and melting at an increasing rate. Here I want to show you how we study such things and why it is so important!
Surface mass balance and the associated mass losses, mainly driven by surface melt, play an important role in the current negative total mass balance of the Greenland ice sheet. It is therefore crucial to monitor the evolution of surface processes in a warming world through key variables such as the snow and ice reflectivity (how much they reflect the sun’s radiations back to space), hereafter referred to as albedo.
Every spring, the highly reflective seasonal snowpack covering the ice sheet is affected by surface melt, resulting in larger snow grains and a lower albedo. As the melt season progresses, the snowpack situated in the ablation area (the area of the glacier where there is a net loss of ice across one hydrological year) is eventually completely melted away, revealing the underlying darker bare ice. Bare ice absorbs sunlight at a high rate, bringing more energy available for melting inside the ice. But when and where does this seasonal transition from snow to bare ice happen? And how can we detect it?
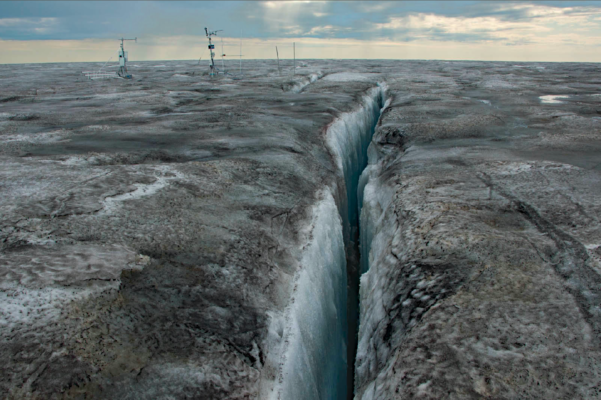
In our latest study, we used ground measurements from automatic weather stations, part of the PROMICE network, to study this seasonal transition at 20 different sites across the ice sheet. We specifically focused on the daily ice ablation measurements from the different weather stations of our dataset and identified the timing of bare-ice appearance, which we defined as the first day of the year where bare ice was observed to be melting. We then synchronised our multi-station and multi-year dataset to the timing of this transition to build a sort of Greenlandic typical signature for this process that we can call a “composite”, focusing on air temperature, snow layer thickness and albedo (see Figure 2). With this composite, we could determine the mean albedo value at the date of bare-ice appearance (0.565, a typical value for moderately dirty ice) that we called the bare-ice onset albedo. We then observed that once the ice was exposed to the atmosphere, its albedo further decreased, resulting in a very dark surface, such as the one visible in Figure 1 for an extreme case at QAS_U weather station in 2014 where an albedo as low as 0.19 was recorded!
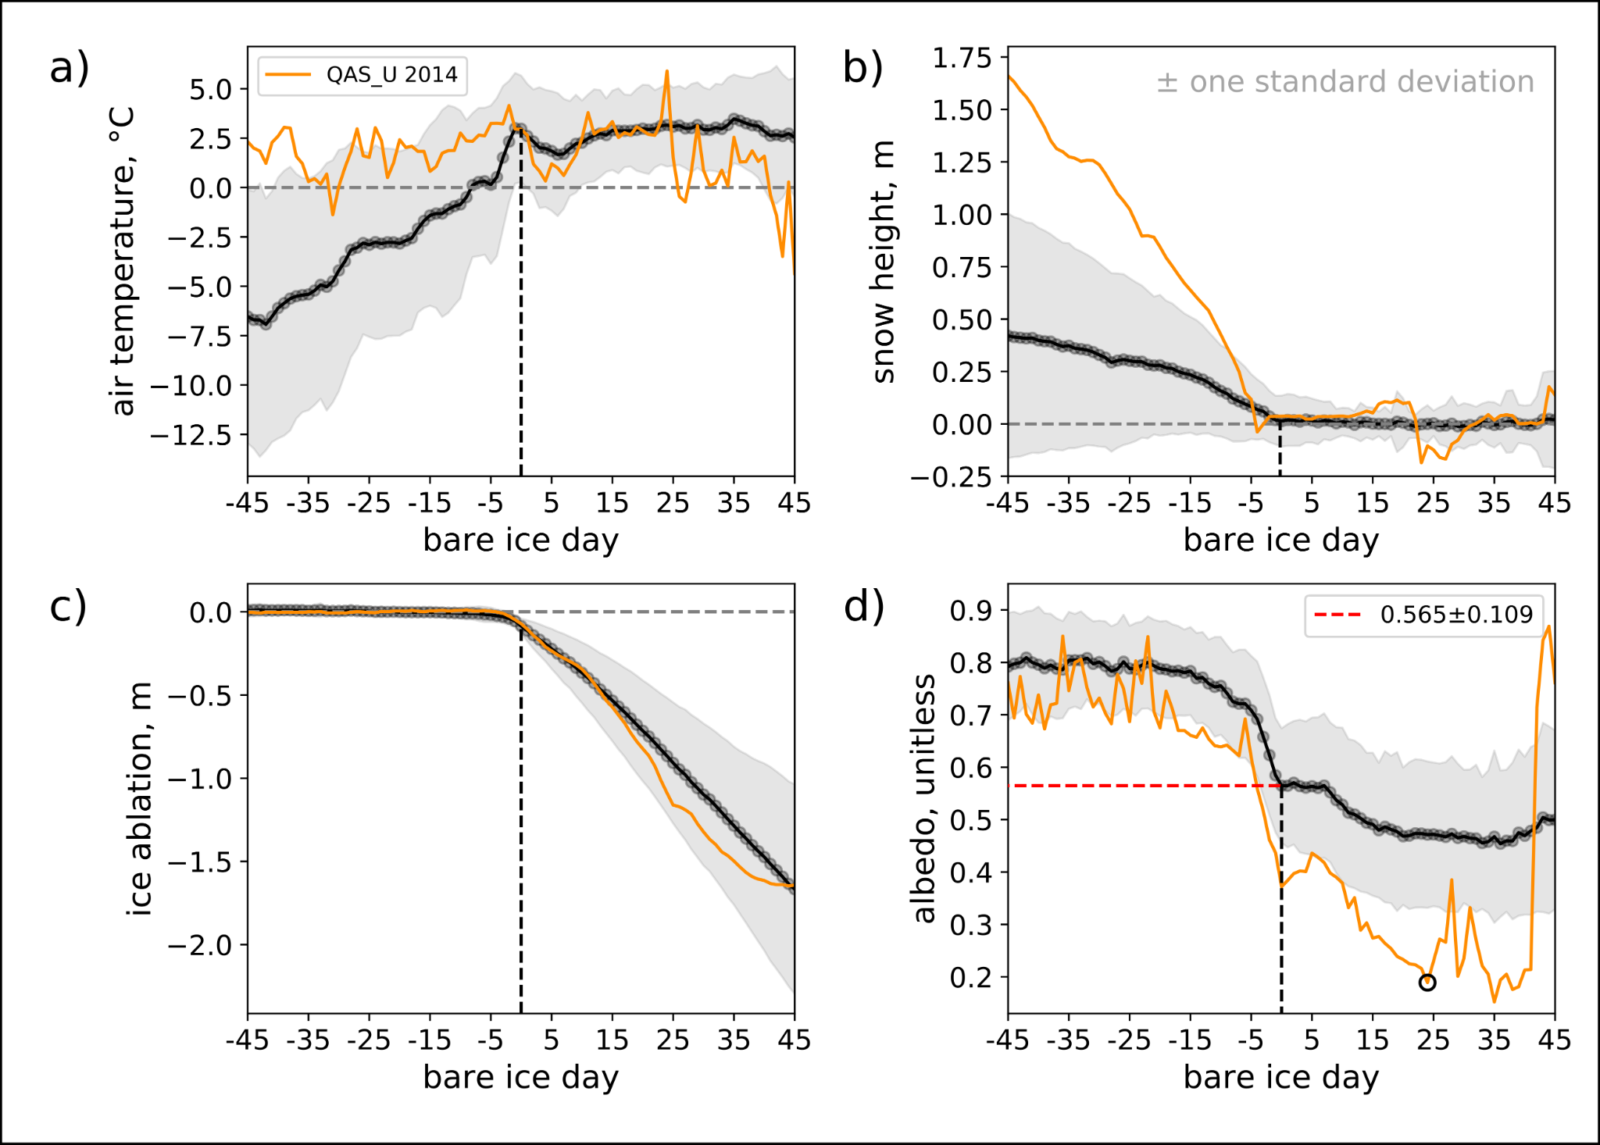
Fig.2: multi-site composite surface conditions synchronized to the emergence of bare ice from ice ablation measurements (the 0 day reference). Black lines refer to the average behavior obtained from the entire dataset here used, the orange ones highlight the evolution of the conditions at QAS_U PROMICE automatic weather station in 2014. The black hollow circle indicates the date at which the picture of Figure 1 was taken.
While the PROMICE network provides unprecedented access to crucial observations at the ice-sheet surface, it still only reflects the local conditions at precise points across this vast area. Fortunately, a fleet of satellites currently observes the Earth every day giving us access to an almost continuous monitoring of remote areas, such as the Greenland ice sheet. In this way, it was possible to apply the bare-ice onset albedo – which we rigorously determined from punctual ground observations – to daily snapshots of the entire ice sheet, and therefore quantify the variations in bare-ice area across the melt season.
To this end, we used an algorithm developed as part of the ESA SICE project for the retrieval of albedo from Sentinel-3 optical satellite imagery and specifically focused on the extremely low and high respective melt years of 2018 and 2019. We found that the maximum daily bare ice area was 1.9 times larger in 2019 than in 2018 (153,489 km² and 80,220 km², respectively) therefore covering 9.0 % and 4.7 % of the ice sheet. While the peripheral ice caps only represent ~3.6% of the ice sheet area, their addition increased 2019 and 2018 maximum daily bare ice areas by respectively 17.2% and 15.5%. I realize that these numbers are not that easy to comprehend at a glance, but trust me, it shows there are strong variations from year to year in Greenland as shown here for 2018 and 2019!
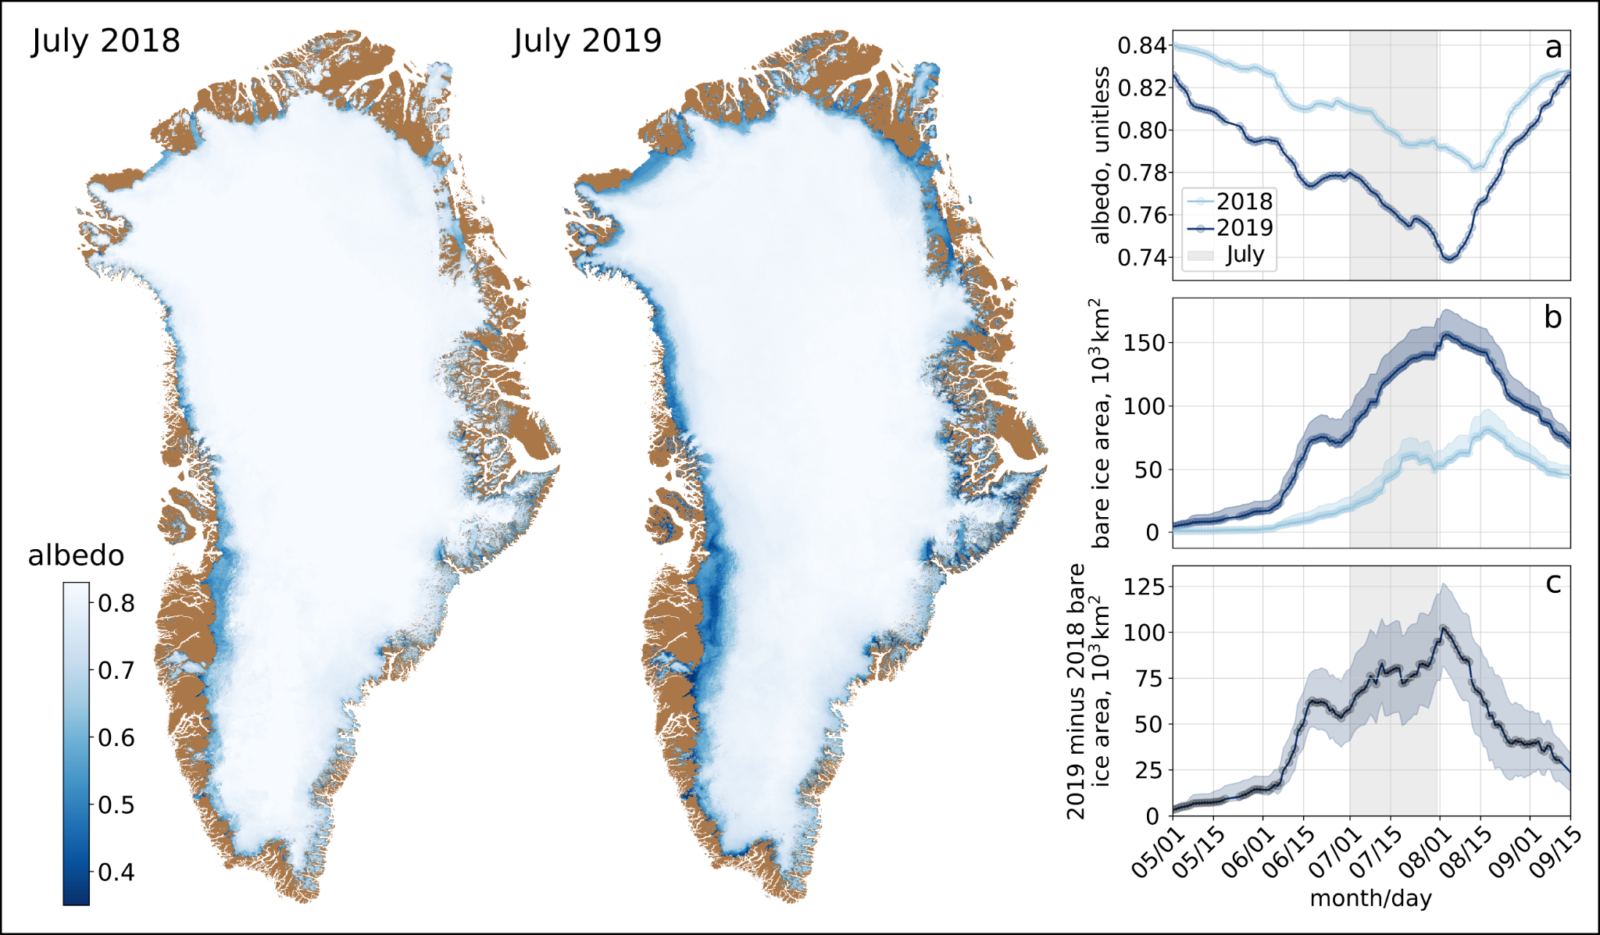
Fig.3: Maps of 2018 and 2019 July average Greenland snow and ice albedo from Sentinel-3. Inset figures feature a) area-averaged albedo and b) bare-ice area for the low melt 2018 and high melt 2019 melt seasons. Inset figure c) illustrates the difference between the 2018 and 2019 Greenland bare-ice areas. More details can be found here.
Monitoring the processes currently ongoing at the surface of the Greenland ice sheet is key to move towards a better understanding of ice-climate interactions both on short and longer timescales. Indeed, processing and analysing remotely sensed data as soon as they have been acquired provides precious information that can be assimilated in forecast models to improve their efficiency. In this way, we recently implemented the algorithm for albedo retrieval from Sentinel-3 satellite imagery as part of the SICE project to operate Near-Real Time. You can therefore check yesterday’s Greenland snow and ice albedo as well as the extent of the bare ice area compared to the previous years here any time!
Ultimately, a better understanding of the present conditions in Greenland will improve our capacity to simulate the future evolution of the ice sheet and therefore, its contribution to sea level rise. It’s incredible how much you can understand from space, isn’t it?
Further reading:
- Wehrlé, A., Box, J. E., Niwano, M., Anesio, A. M., & Fausto, R. S. (2021). Greenland bare-ice albedo from PROMICE automatic weather station measurements and Sentinel-3 satellite observations. GEUS Bulletin, 47. https://doi.org/10.34194/geusb.v47.5284
- Read more about snow & ice albedo from the Cryoblog:
Edited by Larissa van der Laan and Giovanni Baccolo
 Adrien Wehrlé recently started a PhD at the University of Zurich, Switzerland. He investigates the dynamics of Greenland outlet glaciers as well as the evolution of surface processes across the Greenland ice sheet using ground measurements, space-borne observations and model simulations. He tweets as @AdrienWehrle. Contact Email: adrien.wehrle@geo.uzh.ch
![Image of the Week – On thin [Arctic sea] ice](https://blogs.egu.eu/divisions/cr/files/2018/10/kayak-161x141.jpg)