It is a pleasure for the EGU Cryoblog team to present a new post category: Cryo-institutes around the world! There are many institutes working on cryosphere-related research spread around the world. The aim of this new category is to highlight the cool research that is carried out at these institutes, showing off our multi-faceted cryo-related science. In this opening post, Ashley Morris will present the first institute: the Norwegian Polar Institute, and for good reason! Norway is one of the countries with the longest and most developed history of polar exploration and research, both in the Arctic and the Antarctic (you may have heard of Roald Amundsen?). Let’s give the floor to Ashley!
Introduction
Since 1928, the Norwegian Polar Institute (and its predecessor, Norway’s Svalbard and Arctic Ocean Research Survey) has been Norway’s national institute for scientific research, mapping and environmental monitoring in the Polar regions. Based since 1998 in Tromsø – the unofficial “Capital of the Arctic” – the institute also has employees in Longyearbyen and Ny-Ålesund in Svalbard, and at the Troll research station in the Dronning Maud Land sector of East Antarctica. The institute’s scientists study biodiversity, environmental pollution, sea ice and the polar oceans, bedrock and marine geology, polar atmospheric science, and glaciology.
A natural laboratory – Svalbard
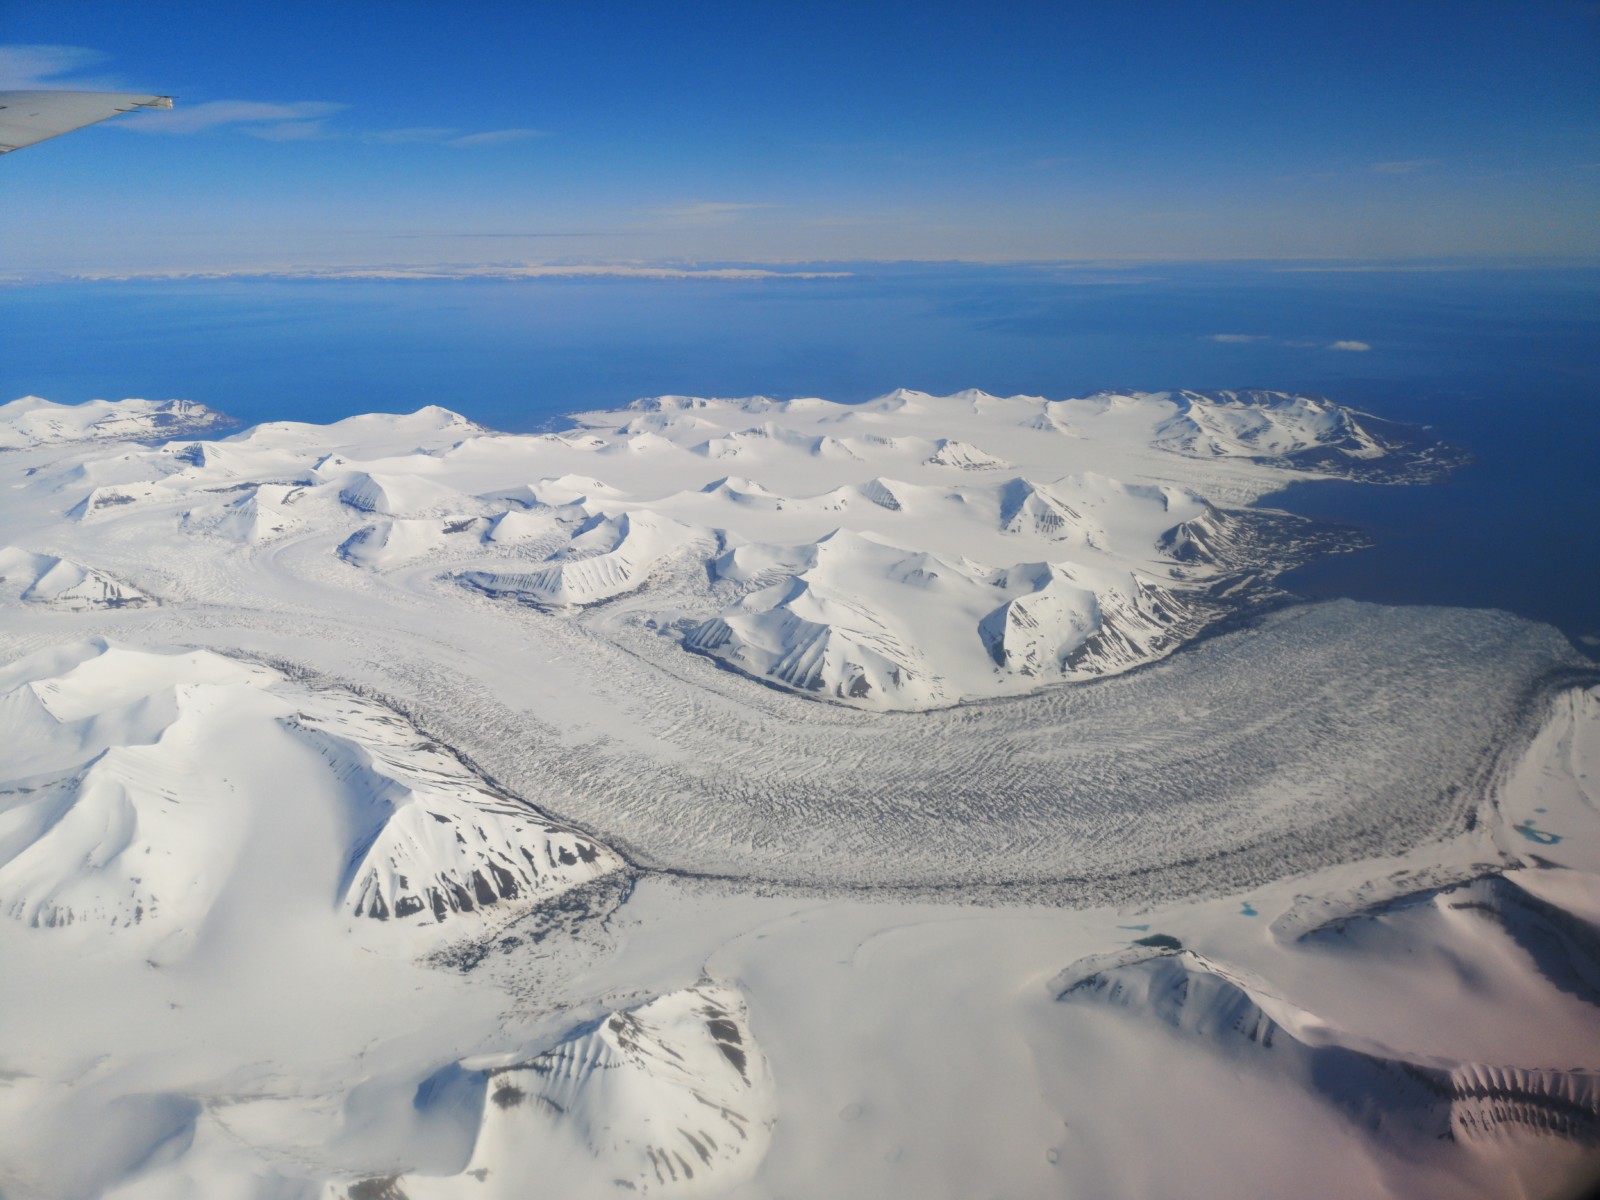
From its (relatively!) warm, Atlantic-influenced west coast, to its wild, remote, perennially sea-ice covered east, the Norwegian Arctic archipelago of Svalbard is home to spectacular geology, diverse glaciers, and more polar bears than people! The collection of islands midway between the Norwegian mainland and the North Pole is a natural laboratory for the researchers of the Norwegian Polar Institute, and other researchers from around the world.
Glaciers cover 32,000 square km (53%) of Svalbard’s land area, varying from cirque and valley glaciers in the area around the main settlement of Longyearbyen – through the interconnected icefields which dominate the northwest, northeast and south of the largest island, Spitsbergen – to the two huge dome-shaped ice caps on the north-easternmost major island, Nordaustlandet (explore the archipelago on TopoSvalbard). Calving fronts, appearing as towering blue-white cliffs, constitute 900 km of Svalbard’s coastline, ranging from kilometre-scale ice fronts at the heads of fjords to the almost 200 km continuous wall of ice along the southern and eastern margins of the Austfonna ice cap.
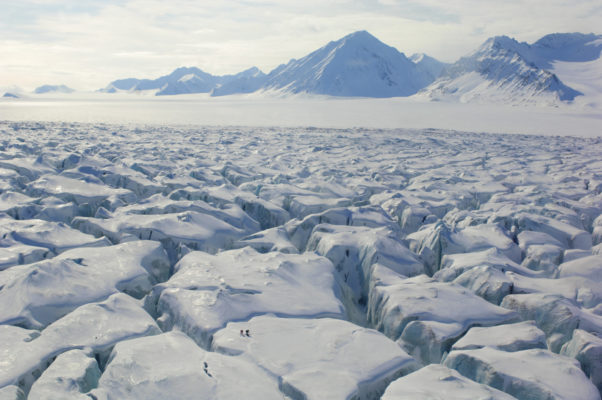
The surging glacier Moršnevbreen in southern Spitsbergen. The surface is crevassed all the way up its tributary glaciers. Credit: Ann Kristin Balto, Norsk Polarinstitutt.
In recent years, even the flight between Tromsø and Longyearbyen has demonstrated why Svalbard glaciers are so interesting. Amongst the jagged peaks and smooth, snow-covered glaciers of southern Spitsbergen, the chaotically-crevassed surface of Moršnevbreen (‘breen’ is Norwegian for “the glacier”) stands out (see the above picture). Unlike neighbouring marine-terminating glaciers, on which large crevasses are generally confined to near the calving fronts, its surface is crevassed along its whole length. This is because Moršnevbreen is a ‘surge-type’ glacier and is now in its active phase. Surge-type glaciers exhibit cyclical dynamics, alternating between a long, ‘quiescent’ phase and a short, ‘active’ phase. During the quiescent phase, the glacier barely flows, and ice gradually accumulates in the upper accumulation basins. Beyond a certain threshold ice starts to rapidly move downstream and the surge phase begins. This is what is now happening to Moršnevbreen! Surge-type glaciers exist in clusters in places like Svalbard, Alaska, and the Karakorum mountains. Recent studies of surge-type glaciers in Svalbard have furthered our understanding of them (Sevestre and Benn, 2017). There’s another glacier on Spitsbergen which is “on the verge of a surge”: Kongsvegen. Ice flow is accelerating and crevasses are opening, and the race is on for the Norwegian Polar Institute and collaborators to collect as much data as possible to understand what happens as the surge initiates.
Much of the Norwegian Polar Institute’s glaciological work in Svalbard is focused on mass balance monitoring, visiting the same glaciers once or twice a year to maintain and measure a mass balance stake network. This is fundamental to assess glacier health. Traditional monitoring consists of drilling long metal poles into the ice surface. On each visit, the distance from the top of the pole to the ice surface is measured, along with snow depth and density, allowing calculation of accumulated or melted glacier mass since the previous visit. We also measure the position of the stake using GPS, allowing calculation of ice flow. GPS receivers attached to snowmobiles are also used to measure glacier surface elevation changes along repeated transects linking mass balance stakes and other installations, such as automatic weather stations. In the spring, snow depth is also profiled using ground penetrating radar and avalanche probes, and its properties analysed by digging snow pits and taking samples.
Such studies on Svalbard are a truly international affair, with the Polish Academy of Sciences, Russian Academy of Sciences, the Polar Research Institute of China/Chinese Academy of Science, the French Polar Institute, and several universities running mass balance programmes on a number of glaciers. The majority are along the west coast of Spitsbergen, particularly around the research town of Ny-Ålesund, where the Norwegian Polar Institute runs four programmes continuing uninterrupted time-series started in 1967 and 1968 on valley glaciers Austre Brøggerbreen and Midtre Lovénbreen, in 1987 on marine-terminating Kongsvegen, and in 2003 on fast-flowing Kronebreen and its ice cap Holtedahlfonna. The only current mass balance programme outside of Spitsbergen is the Norwegian Polar Institute/University of Oslo programme on the Austfonna ice cap in the far northeast of Svalbard, one of the largest glaciers in Europe.
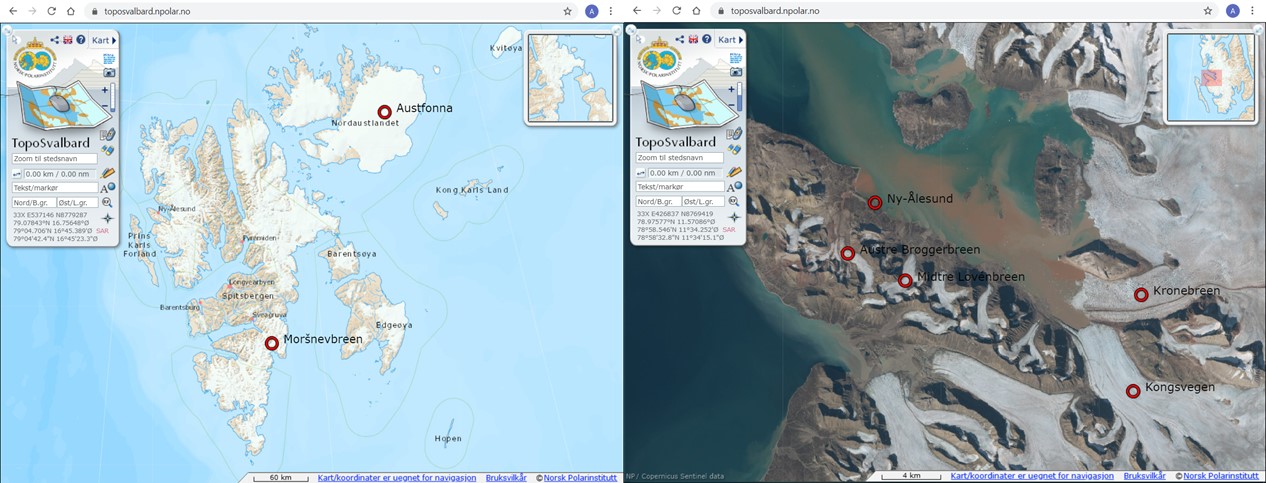
Explore the Svalbard archipelago using the Norwegian Polar Institute’s online map, TopoSvalbard. The left image shows the Austfonna ice cap and the surging glacier Moršnevbreen on the basemap, right shows the Ny-Ålesund area study glaciers overlaid on satellite imagery. Credit: TopoSvalbard, Norsk Polarinstitutt.
The Austfonna programme was started in 2004, providing in situ mass balance measurements of a large ice cap located in the colder, northeast of the archipelago. This gives a more representative picture of archipelago-wide mass balance by reducing the bias to the west coast and to smaller ice masses. The expansive, gently sloping ice cap is also an ideal location for the calibration and validation of data from altimetry satellites such as the European Space Agency’s CryoSat-2. As part of the European Space Agency’s CryoVEx project, teams from the Norwegian Polar Institute and University of Oslo have coordinated fieldwork with aerial surveys by the Danish Technical University and Alfred Wegner Institute to produce reference elevation transects for comparison with satellite data.
Back in the office – Tromsø
As much as we’d like to, we can’t spend all our time in the field! Outside of our spring and autumn fieldwork, we spend our time at the office in Tromsø combining those hard-earned field data with remote sensing data and the outputs from computer models to monitor the total mass balance of Svalbard’s glaciers, the dynamics of the glaciers, and links with the wider environment, including oceanography and biology.
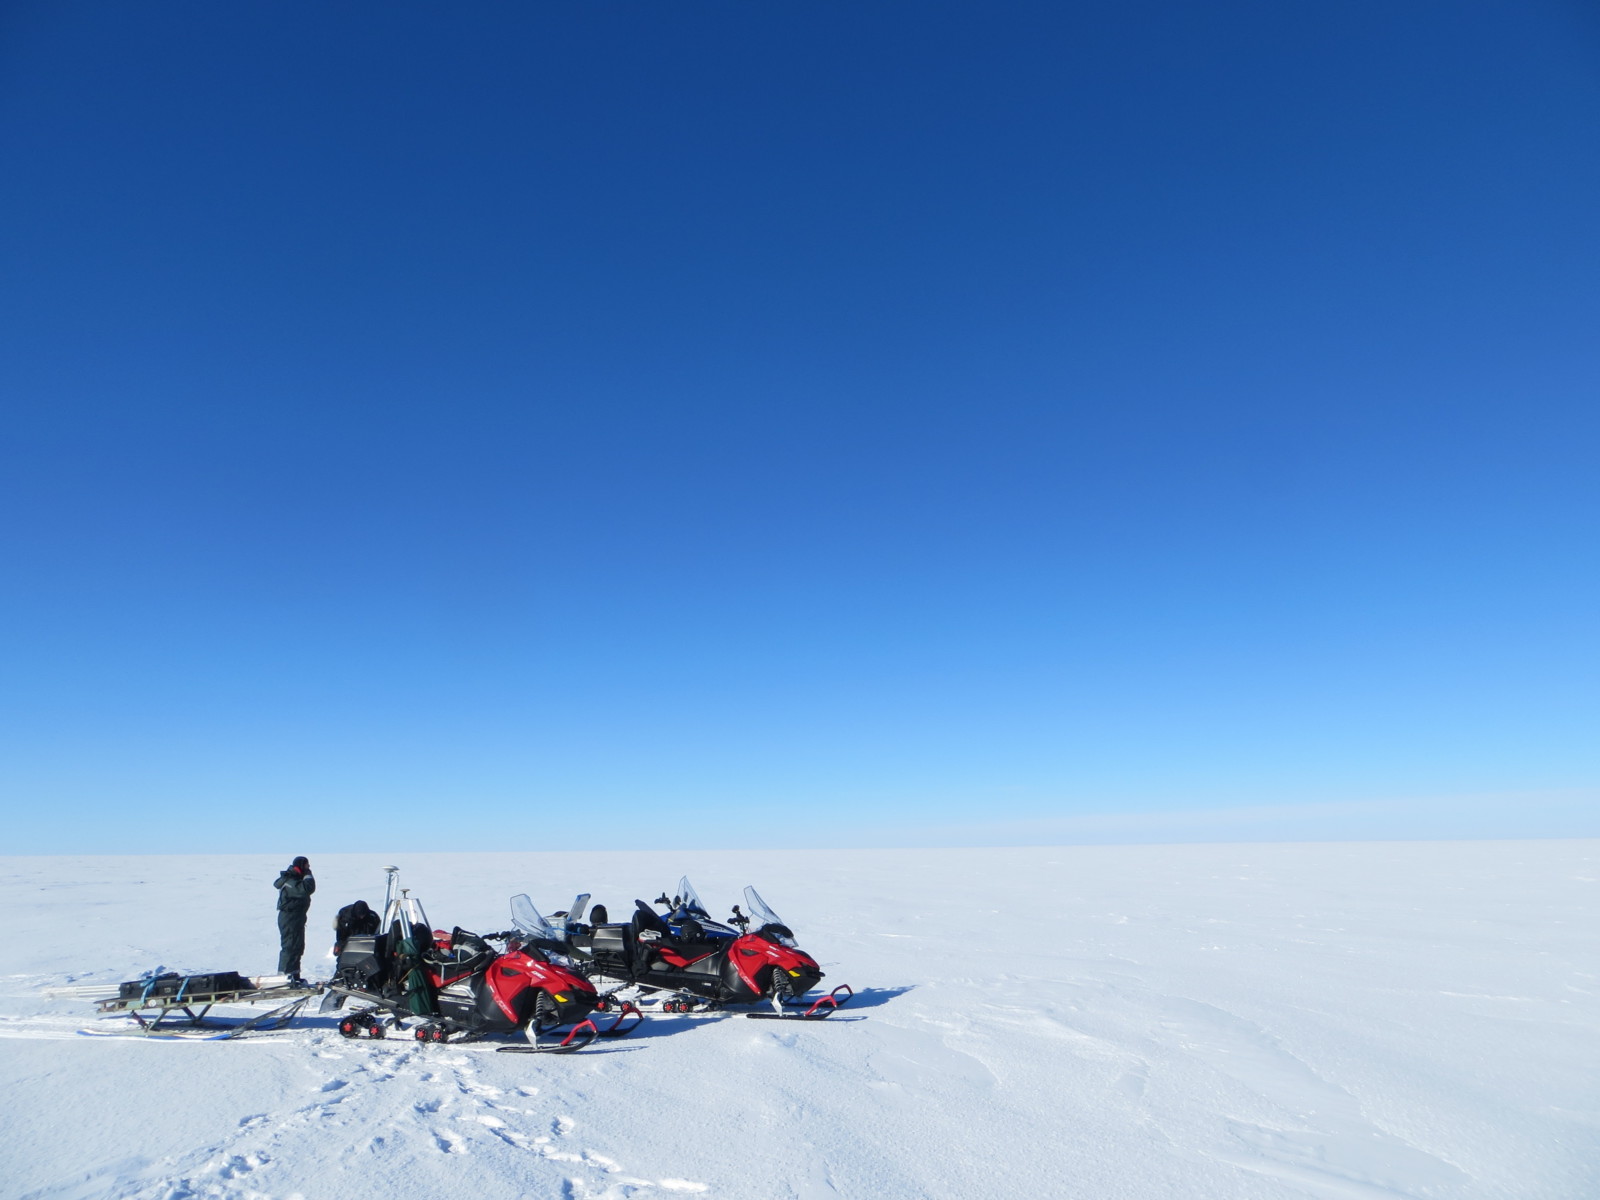
When it’s -20˚C and a blizzard outside, we may dream of being back at the office, but on days like this there’s no better place to be! Norwegian Polar Institute and University of Oslo glaciologists near 80°N on the Austfonna ice cap. Credit: Ashley Morris, Norsk Polarinstitutt.
Satellite remote sensing allows us to expand our mass balance estimates to the entire archipelago. Data from the European Space Agency’s CryoSat-2 showed that between 2011 and 2017, Svalbard lost around 16 billion tonnes of ice per year, equivalent to about 0.05 mm per year of global sea level rise. It may not sound like much, but it’s four times higher than the approximately 4 billion tonnes per year measured between 2003 and 2008 using NASA’s ICESat laser altimeter. Whilst the warmer west coast was losing mass rapidly during both periods, mass loss from the southeast coast of Spitsbergen, the eastern islands (including the Austfonna ice cap) and large surging glaciers was much larger during the more recent period (Morris et al, 2020).
We’re now working to improve the calculation of annual mass balances. To do this, we are using high resolution digital elevation models made from satellite images (ArcticDEM), and collaborating with international scientists to apply feature tracking algorithms to satellite imagery to measure ice flow. This allows us to separate mass losses due to surface processes from those due to calving and melt by the oceans, and to identify lots of surging glaciers! Our archive of historical aerial photos is also helping us to extend the record of Svalbard glacier changes back in time. Using 5,500 aerial photos acquired in the 1930s, we’re constructing digital elevation models which will give us an insight into the long-term changes of the glaciers.
From the long term to the immediate: 2020 was a difficult year for all of us, and restrictions meant conducting fieldwork was challenging. We were lucky to be able to visit both our Ny-Ålesund and Austfonna field sites, where we found that 2020 was also a difficult year for Svalbard’s glaciers. The combination of record low snow accumulation through the winter of 2019-2020, and record high temperatures in summer 2020 led to the most negative mass balance measured on the four Ny-Ålesund glaciers. The one upside of the low snow extent in the late summer is that we were able to use high resolution satellite and aerial imagery to map crevasse extent, ensuring safer future fieldwork for our researchers and safer travel for those living in Ny-Ålesund. We are also using this imagery to create an updated glacier inventory for all of Svalbard.
To the other side of the world – Antarctica
The distance from our home in Tromsø to our logistical base in Longyearbyen is less than 1000 km, but to Troll Station in Antarctica it is more than 15,000 km! Troll is Norway’s year-round Antarctic research station, located in an area 235 km from the Dronning Maud Land coast, where nunataks pierce the thick ice of the East Antarctic ice sheet. From here, and from Norway’s new icebreaker RV Kronprins Haakon, Norwegian Polar Institute glaciologists, oceanographers, and international partners deploy and retrieve instruments and conduct fieldwork to study the climate, glacier mass balance history, ice shelf-ocean interactions, and ice interactions with the biosphere in coastal Dronning Maud Land.
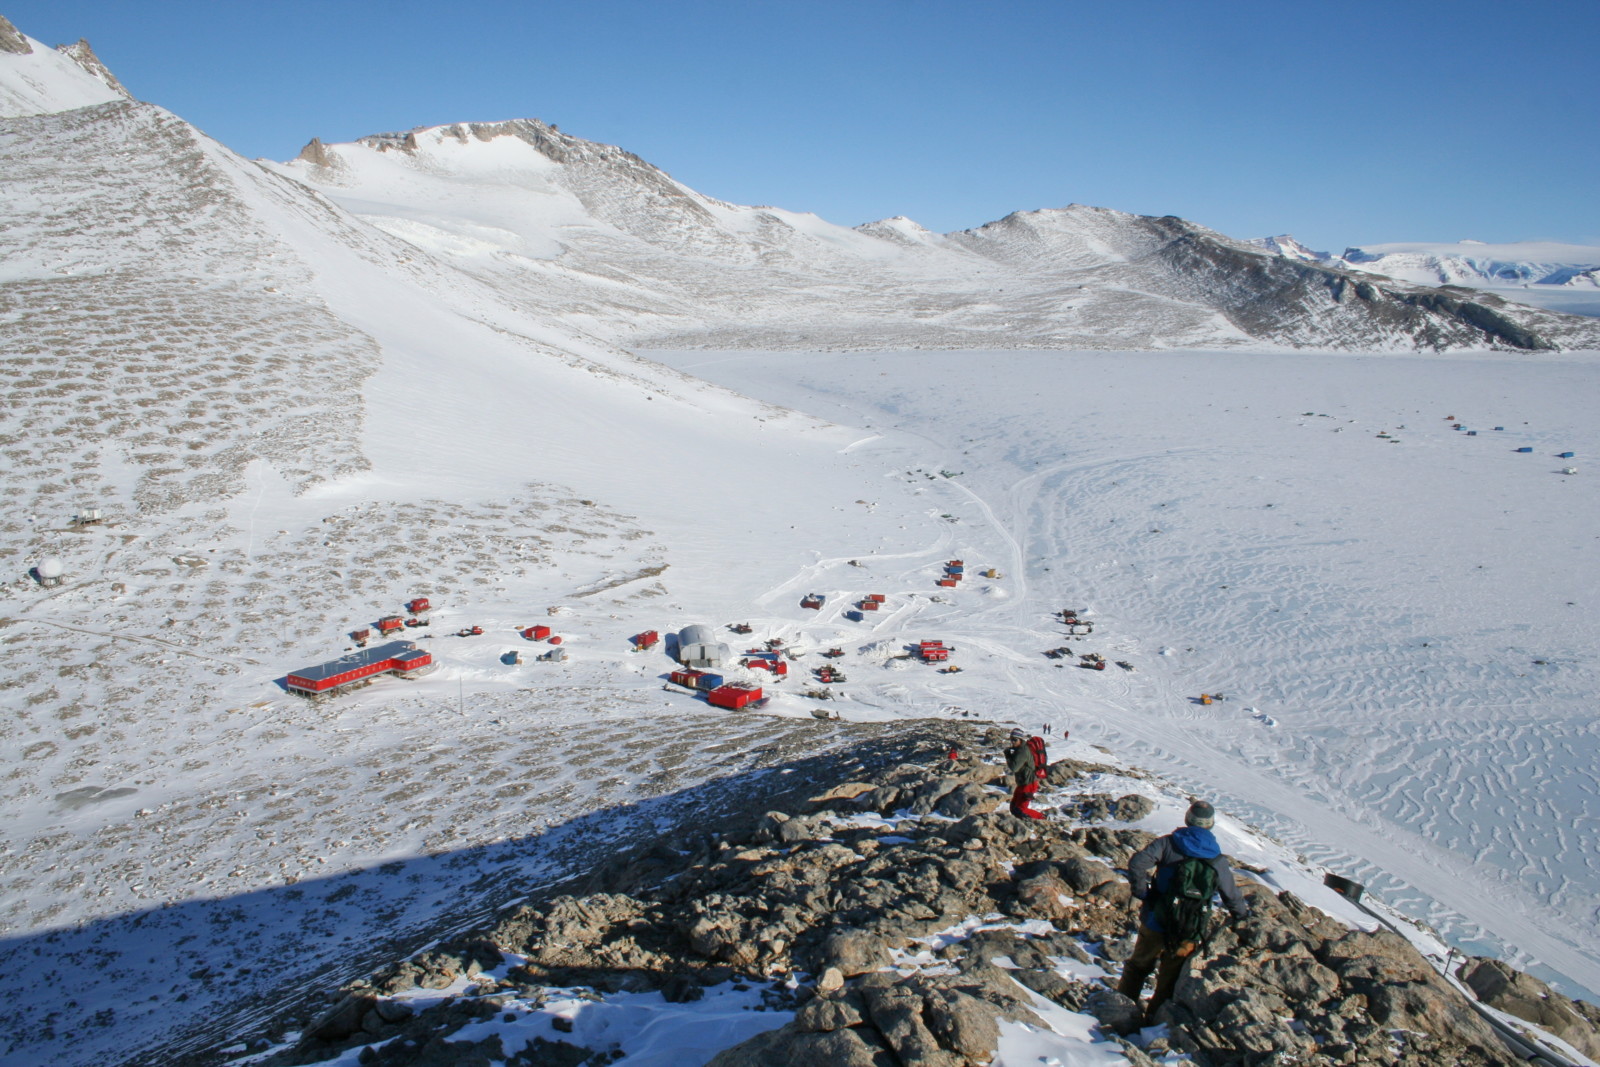
The Norwegian year-round research station, Troll. Credit: Stein Tronstad, Norsk Polarinstitutt.
The Ice Rises project used GPS and radar profiles, radar measurements of ice thickness change and firn coring to calculate the mass balance history of the Fimbulisen ice shelf and adjacent ice rises and its potential future behaviour. The MADICE project, a collaboration with the Indian National Centre for Polar and Ocean Research, investigated the long-term history of neighbouring ice shelves and ice rises. The iMelt project studies ice-ocean interaction in Dronning Maud Land, focusing on the effect of channels incised into the base of the ice shelves, using a combination of remote sensing, modelling and field measurements from oceanographic moorings and radars installed within the snowpack. Looking further inland, we have collaborated with Danish and British colleagues as part of the IceGRAV and PolarGap projects to carry out regional airborne geophysical measurements to explore the “pole of ignorance”, an area around the South Pole where virtually no data existed previously.
Closer to Troll station, our researchers have collaborated with researchers from Norwegian and British universities to study microbial life in cryoconite holes in blue ice areas, areas where the wind blows the snow away to expose the glacial ice beneath. The BIOICE project is investigating the chemistry of cryoconite holes, taking water and sediment samples, and drilling shallow ice cores; it’s also working to estimate the areal extent of viable microbial habitats in blue ice areas around Antarctica. Elsewhere on the ice sheet, the Norwegian Polar Institute is involved in ice core drilling on an entirely different scale. The Beyond EPICA oldest ice project is a multi-national collaboration using ice sheet modelling and fieldwork to identify a location at which to drill an ice core and retrieve the ‘oldest ice’. It is hoped the climatic record contained in this ice core will stretch back 1.5 million years!
If you want to explore Antarctica without traveling thousands of kilometres, you can download the Norwegian Polar Institute’s Quantarctica version 3.2, a free GIS data package including basemaps, satellite imagery, terrain models, and scientific data from 9 disciplines covering the Antarctic continent, Southern Ocean, and sub-Antarctic islands.
From the far north of Austfonna to the ice shelves of Dronning Maud Land, the glaciologists of the Norwegian Polar Institute are conducting fieldwork and using satellite data and computer modelling to understand the changes happening in the Earth’s polar regions, and perhaps shedding some light on their future. This post has given an overview of the cryospheric research the institute and its collaborators are carrying out in these amazing places. If you want to stay up to date with the institute’s glaciological research, and see more beautiful photos of our polar regions, follow NPIglaciology on social media (Twitter, Instagram and Facebook).
Further readings
- Morris et al. (2020) “Spread of Svalbard Glacier Mass Loss to Barents Sea Margins Revealed by CryoSat-2.” Journal of Geophysical Research: Earth Surface 125:e2019JF005357, DOI: 10.1029/2019JF005357.
- Schuler et al. (2020) “Reconciling Svalbard glacier mass balance.” Frontiers in Earth Science 8:156, DOI: 10.3389/feart.2020.00156.
- Lydersen et al. (2014) “The importance of tidewater glaciers for marine mammals and seabirds in Svalbard, Norway.” Journal of Marine Systems 129:452-471, DOI: 10.1016/j.jmarsys.2013.09.006.
- Matsuoka et al. (2021) “Quantartica, an integrated mapping environment for Antarctica, the Southern Ocean, and sub-Antarctic islands.” Environmental Modelling & Software 140:105015, DOI: 10.1016/j.envsoft.2021.105015.
Edited by Jenny Arthur and Giovanni Baccolo
 Ashley Morris was a postdoctoral researcher at the Norwegian Polar Institute, based in Tromsø, Norway. He worked with ESA’s CryoSat-2 radar altimetry satellite to study the glaciers of Svalbard and the ice shelves of Dronning Maud Land, Antarctica. He spent three field seasons on the Austfonna ice cap and one in Ny-Ålesund. He is trying to tweet more often as @AshMorris87, and can be contacted at richard.ashley.morris@gmail.com