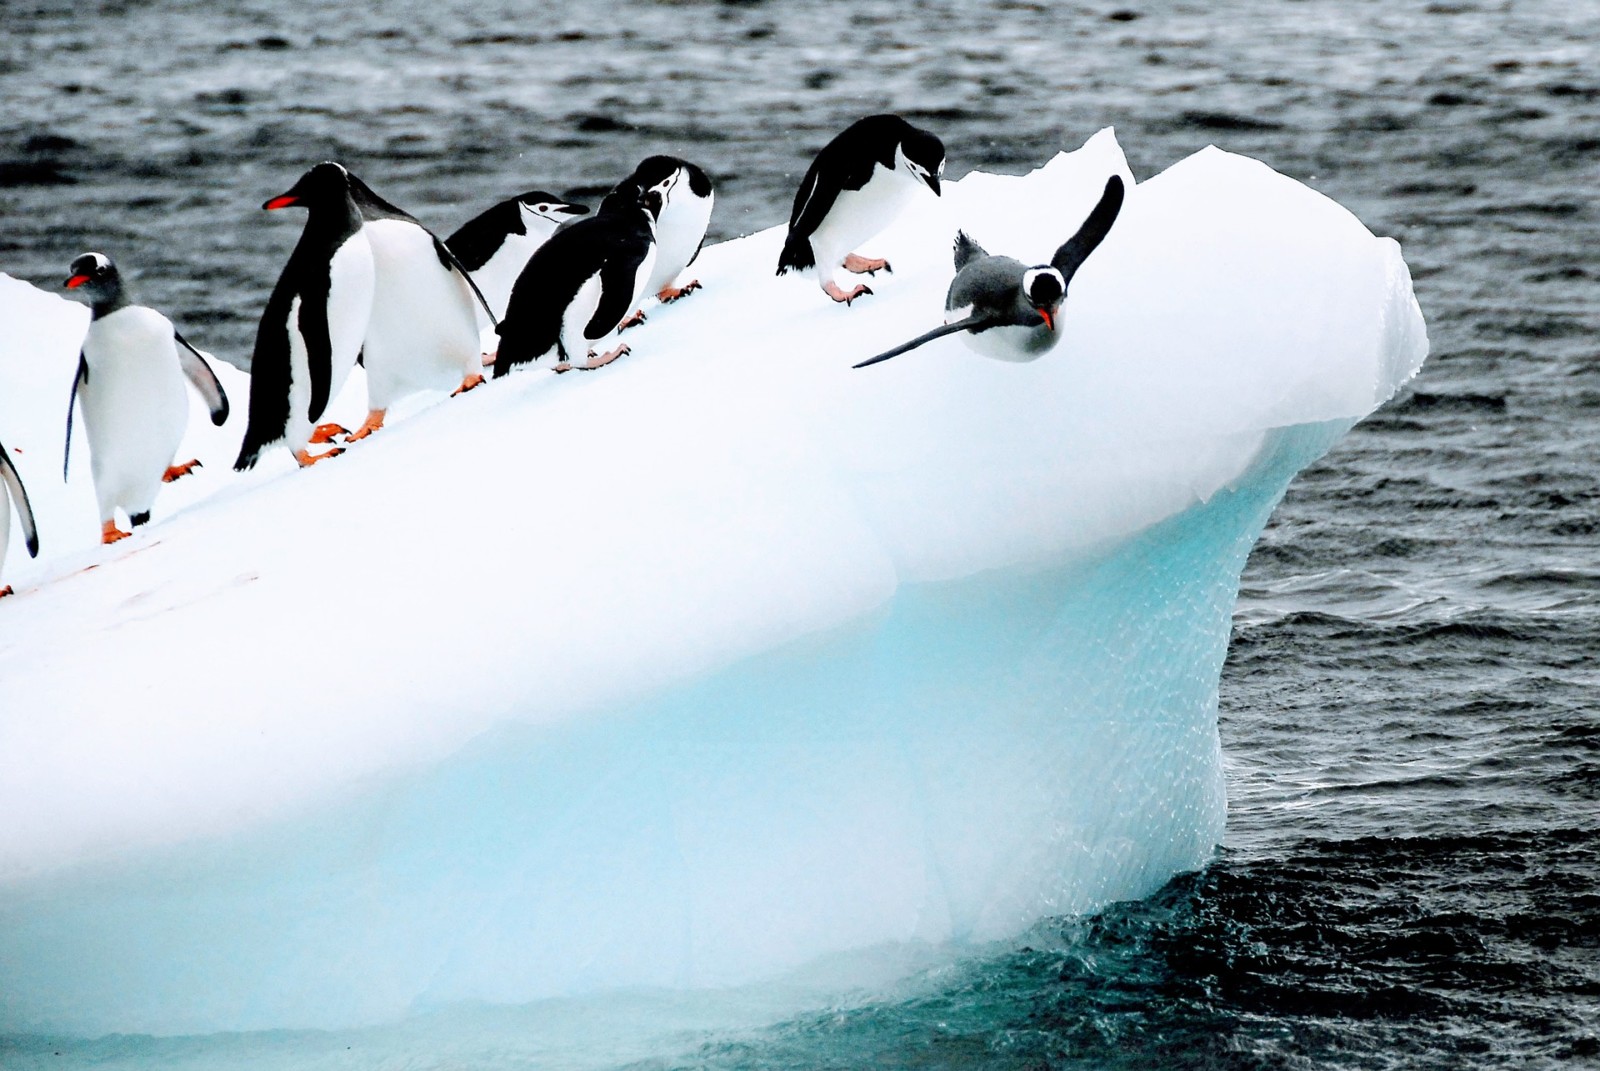
How tilted does the iceberg need to be for the penguins to fall over? [Credit: Pixabay]
As Antarctica’s mass loss increases, the threat of crossing tipping points both in the ice sheet and the surrounding Southern Ocean is increasing. But what actually is a tipping point? Have tipping points already been crossed in the past? And what might the future hold?
What do we mean by a “tipping point”?
Scientifically speaking, a tipping point is generally understood to be a threshold that, once crossed, leads to large scale and irreversible changes. It is tied to a physical system, for example, the Antarctic ice sheet.
A simple example for a tipping point is illustrated by the penguin in Figure 1 (of course a penguin, this is a cryo-blog on Antarctica!). Here, the system is the penguin on the ice floe and the threshold we will be focusing on is the tilt of the ice floe. The penguin is stable when it is standing on the flat ice floe, and a small amount of tilt causes no problem for the penguin; it is able to stay standing. But if the ice floe tilts too far, the penguin crosses its tipping point: it becomes unstable and falls over.
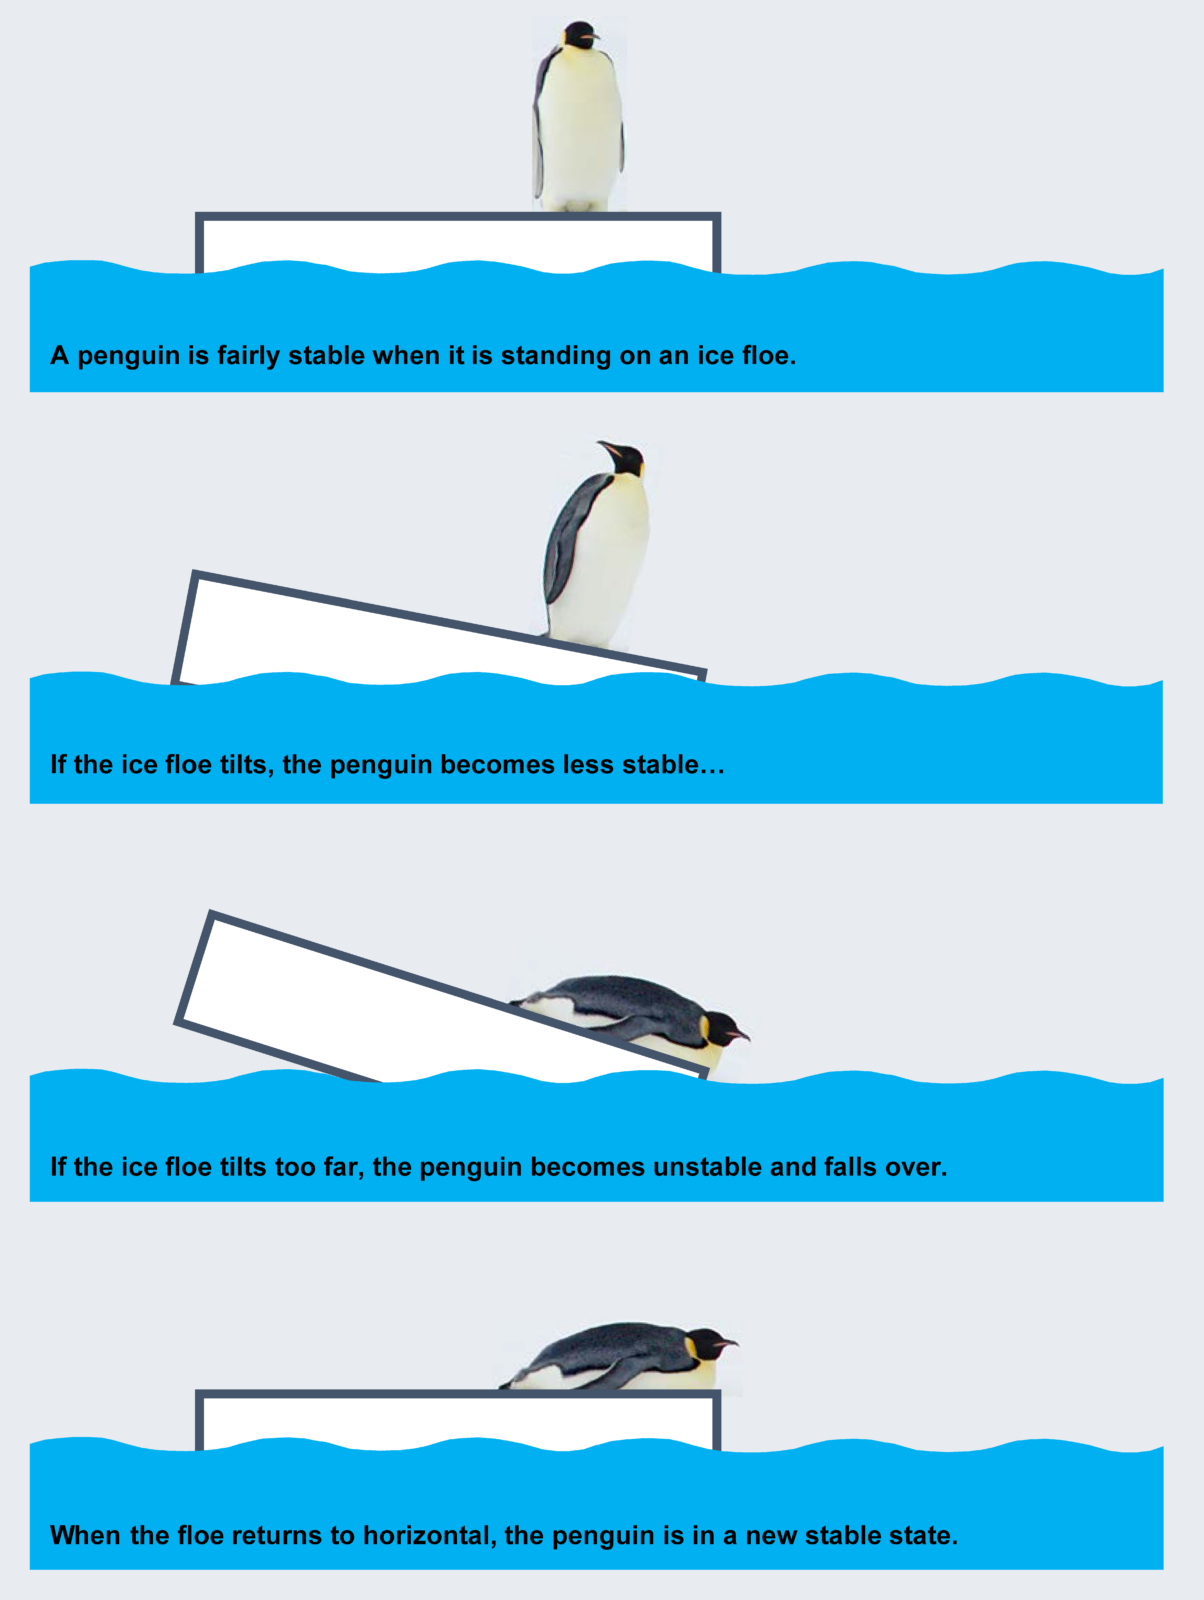
Figure 1: Example of a simple tipping point.
In Antarctica, this could be an analogy for global warming and the size of the ice sheet. A small change in the temperature of the ambient atmosphere or ocean has little effect on the size of the ice sheet, but beyond a certain warming threshold, the ice sheet suddenly becomes much smaller. If global temperatures were restored to their pre-warming levels, the ice sheet would stay in this new, reduced configuration. That means that some of the ice loss — and its resulting sea-level rise — would be irreversible. In contrast to the penguin falling over within seconds after crossing a tipping point, an ice sheet can take centuries to millennia to reach its final state. This means that if a tipping point of the ice sheet is crossed now, the resulting sea-level rise is not immediate, but it is locked-in: the ice loss will continue over a very long time and this cannot easily be stopped.
This highlights a second feature of tipping points: they can be hard to reverse. In our penguin example, the penguin remains in this new stable state (lying on the floe) even if the floe returns to its original state. To get the penguin back to standing, the floe would require a lot more tilting in the opposite direction than just going back to the original state (and maybe even this is not sufficient).
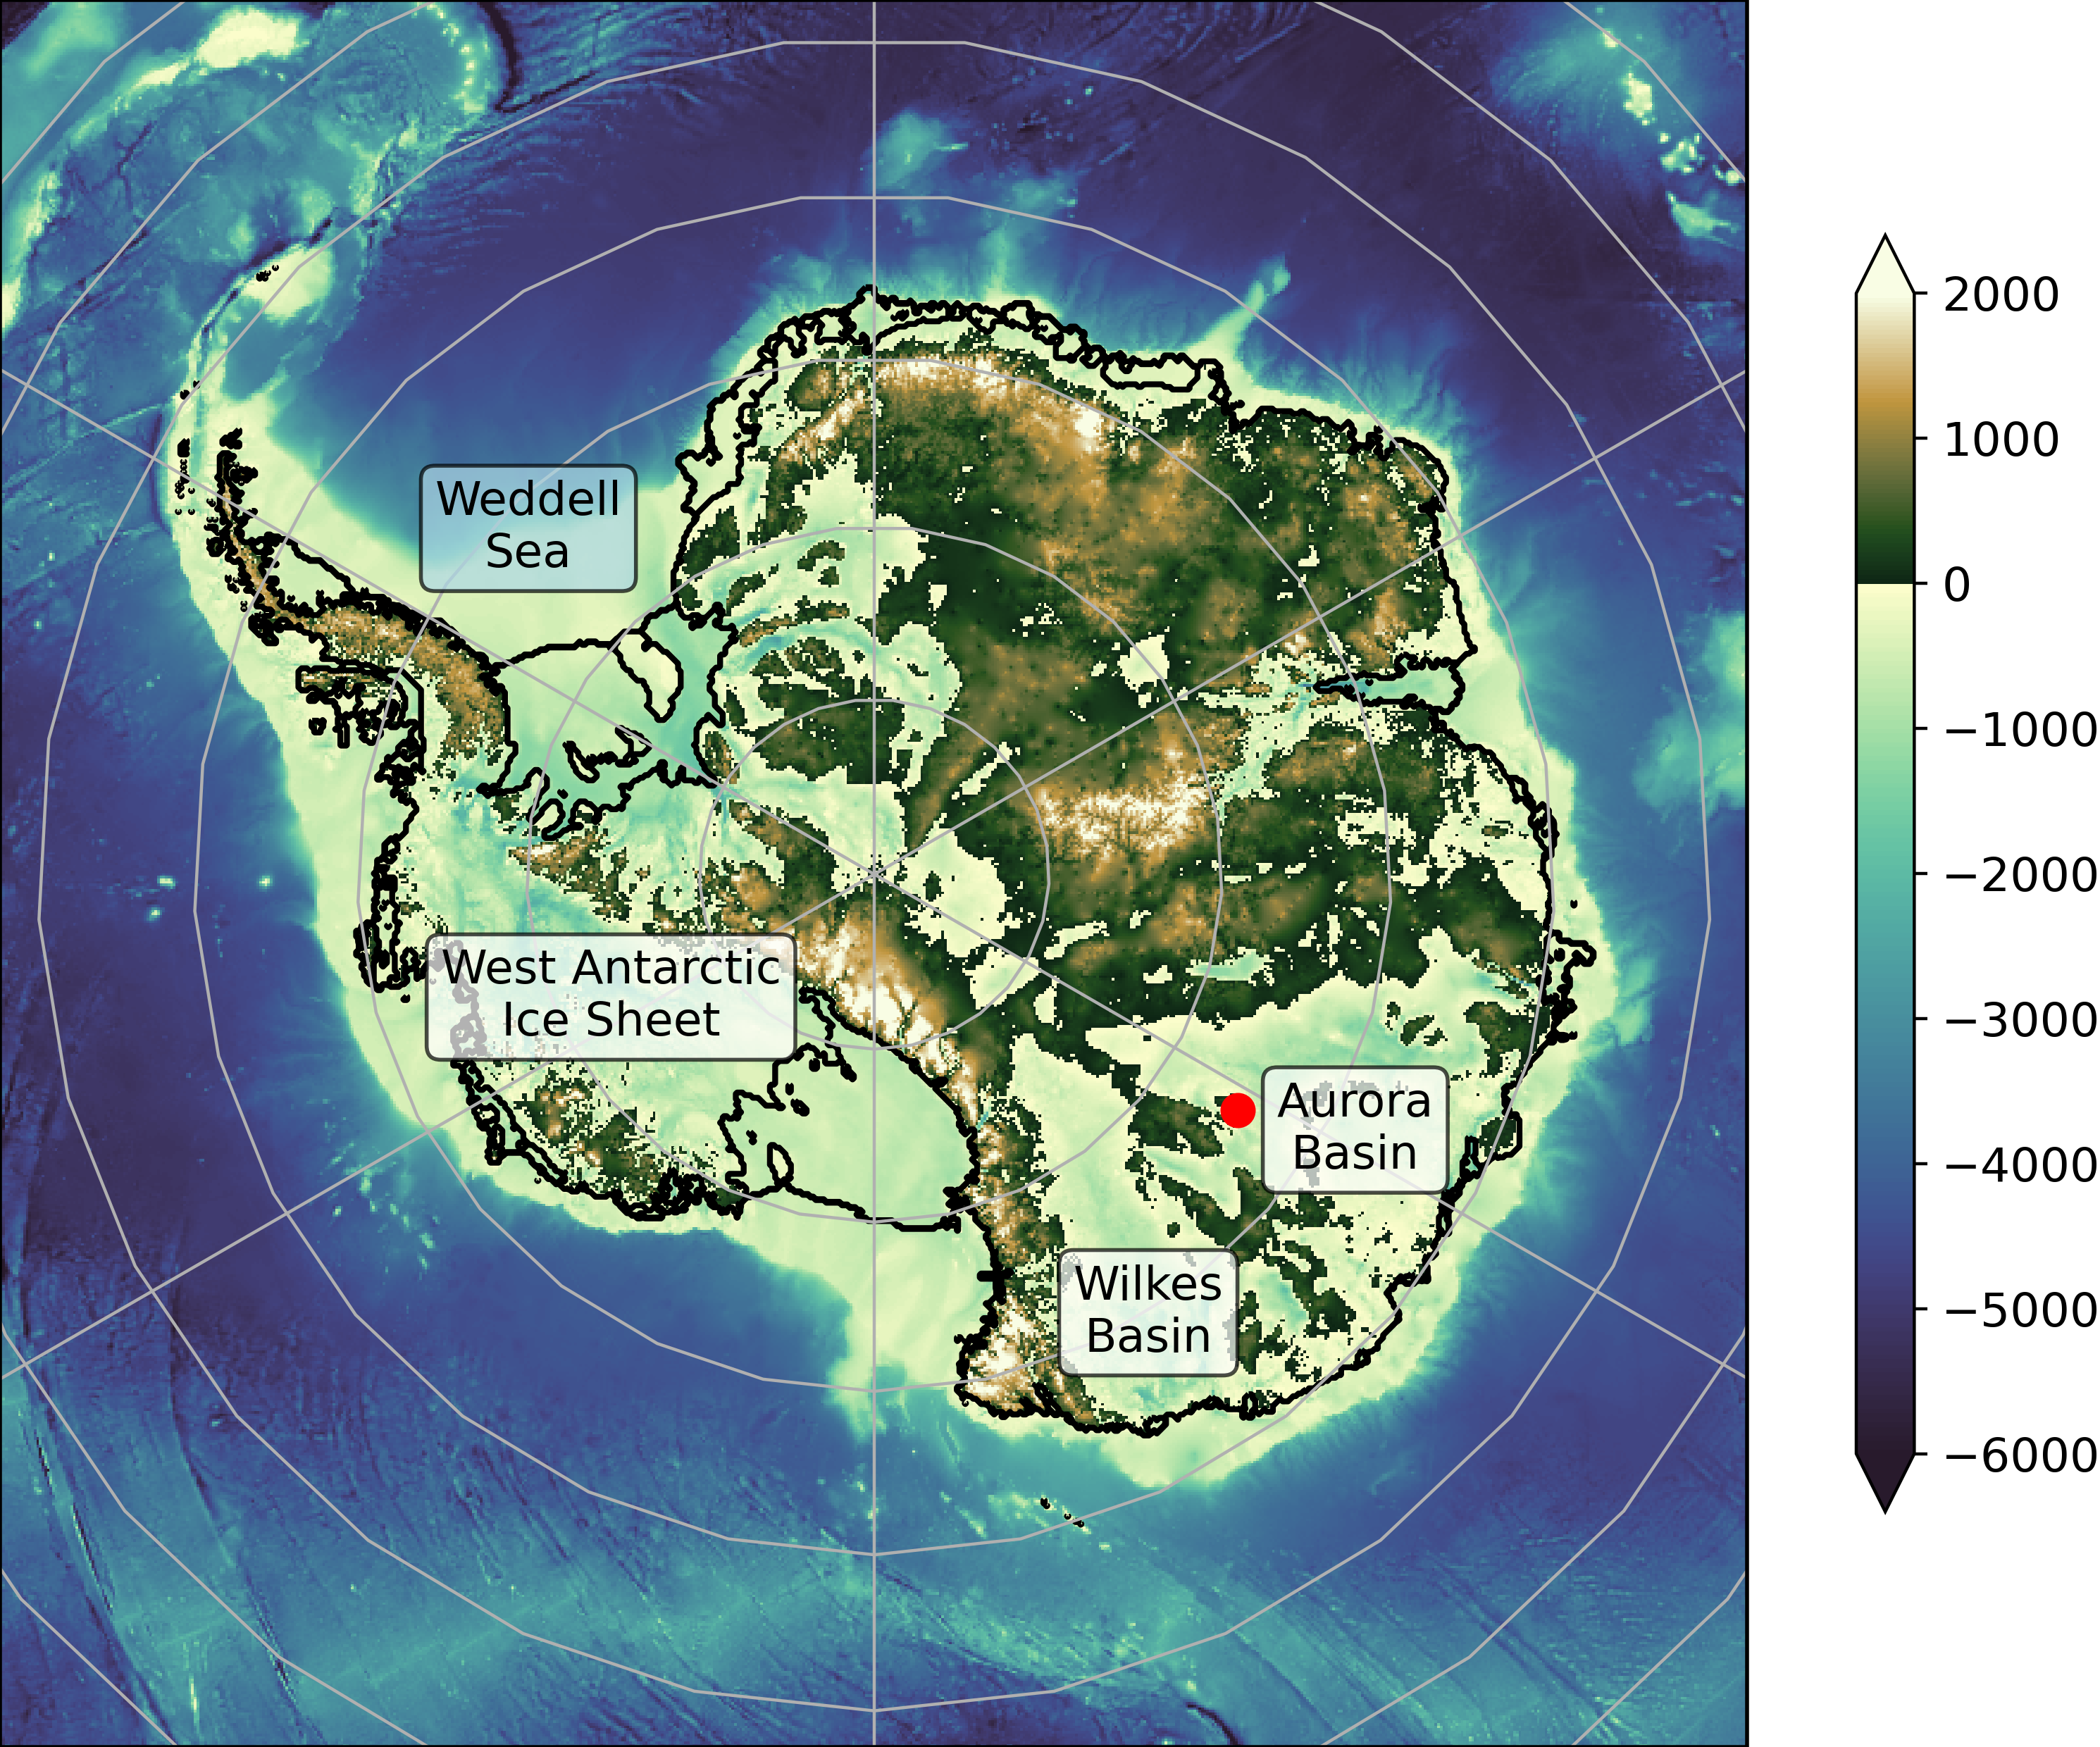
Figure 2: Underlying Antarctic topography with named regions that might exhibit tipping processes. Ocean components are indicated by a blue background and ice sheet components by a white background. Topography is from BedMachine Antarctica version 2 (Morlighem et al., 2019). Red dot shows the location of the EPICA Dome C ice core. The outline of the Antarctic Ice Sheet is shown in black, with also the floating ice shelves separated by black contours from the grounded ice sheet. [Credit: Ronja Reese].
The Weddell Sea: an example of tipping point in the Southern Ocean
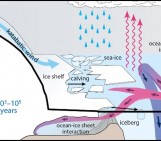
Today, much of the Antarctic continental shelves are dominated by cold ocean water, with ‘cold’ meaning that they are close to the surface freezing point (this is the temperature at which water freezes to ice; see this post to know more about water masses). They are shielded from warmer waters sitting offshore by the so-called ‘Antarctic Slope Front’, which lies roughly where the colors change from light to dark blue at the continental shelf in Figure 2 (‘warmer’ is a relative term here as these waters are still cold, but a few degrees warmer than the other water masses — and these few degrees can make a big difference!).
The stability of the Antarctic Slope Front is controlled by a complex balance between the ocean circulation, winds, sea-ice and melting below the floating ice shelves. If these conditions change, the front can be disrupted and thereby a tipping point crossed: the coastal waters tip to ‘warm’ ocean conditions. And the warm conditions are sustained by a self-reinforcing feedback: once the warm waters enter the space underneath the floating ice shelves, they drive more melting of the ice. This melting, in turn, strengthens the ocean circulation and thereby sustains the presence of warm water.
This process is quite well-established in theory, but is it actually observed in the Southern Ocean? Well, some studies (such as this one or this one) suggest that this type of tipping point exists at the Filchner-Ronne ice shelf in the southern Weddell Sea, and moreover, that it could be crossed by the end of this century under high greenhouse gas emissions!
Marine Ice Sheet Instability: a tipping point for the Antarctic Ice Sheet
Tipping points of the Antarctic ice sheet are often linked to the so-called Marine Ice Sheet Instability. This can occur in regions where the ice is grounded below sea-level (see Figure 2) and where the bed deepens into the ice sheet’s interior. Regions that satisfy these criteria are, for example, the West Antarctic ice sheet and the Wilkes and Aurora basins in East Antarctica. In those regions, a self-reinforcing feedback can be triggered. It is linked to the ice flow at the grounding line – where the grounded ice starts to float on top of the ocean and forms the ice shelves. If the ice sheet melts, the grounding line retreats on a bed that deepens inland, and a tipping point can be crossed! Indeed, the ice thickness at the grounding line increases, which, in turn, can cause more ice to flow across the grounding line and thereby cause further retreat. If you want to learn more about the instability check out this post.
The amount of change needed to trigger the Marine Ice Sheet Instability (and thus to cross a tipping point) in the different regions in Antarctica remains an open question that many people are working on… but it is thought that just a couple of degrees of ocean warming may be sufficient!
Have tipping points been triggered before?
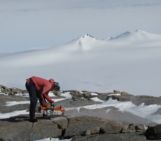
Many of the past changes in the Earth’s climate have been preserved in ice, ocean sediments, and even cave stalagmites. Over thousands or even millions of years, layers of sediments in the ocean and layers of ice on the ice sheet gradually accumulate, with each layer recording some sort of climatic signal. Unravelling these records can be quite a challenge, but they provide clues about how the Earth might look under warmer conditions — and so help us figure out whether tipping points have already occurred in the past.
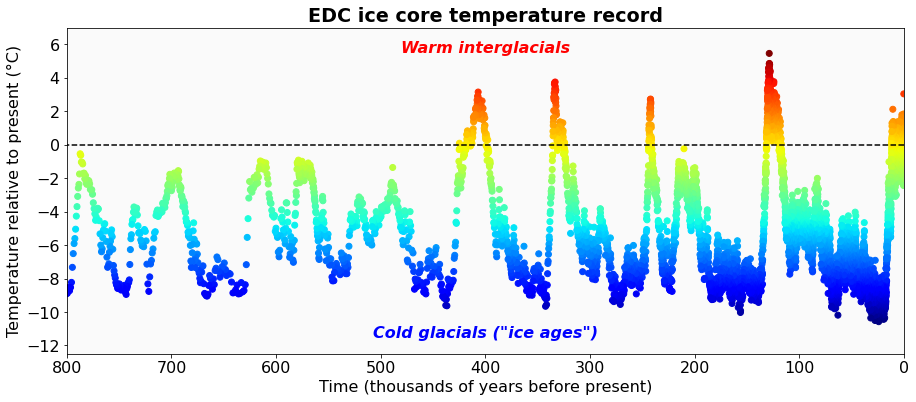
Figure 3: Has the Antarctic ice sheet been stable in the past? This plot shows reconstructed air temperature in the EDC ice core from East Antarctica for the last 800,000 years. This part of the ice sheet has survived many previous warm periods (called “interglacials”) when the temperature in Antarctica was a few degrees warmer than present. However, West Antarctica (which is mostly grounded on bedrock below sea level) probably did not survive through all of these warm interglacials [Credits: data from Jouzel et al. (2007), figure from Dave Chandler]
One of the warmest recent interglacial periods was probably the last interglacial, about 130,000 years ago. Evidence from ice cores (and from other geological sources) suggests that West Antarctica was probably much smaller during this last interglacial, compared to its present extent. Therefore, the warmer conditions of the last interglacial were probably sufficient to cause a lot of ice loss from West Antarctica — though not from East Antarctica. This suggests that even today, only a few degrees of warming above present conditions could be sufficient to cause major Antarctic ice loss, resulting in perhaps a few metres of sea level rise. For comparison, sea levels during the last interglacial were most likely 6 to 9 m higher than they are now. That amount of sea level rise now would obviously cause a lot of flooding of the world’s coastal cities. This makes it an urgent issue, in particular because the time scales for collapse of the West Antarctic Ice Sheet remain very uncertain.
Could it happen in the future?
In 2014, it was reported that an ice-sheet tipping point related to the Marine Ice Sheet Instability might have already been crossed or could soon be crossed in the Amundsen Sea (see this post). Increasing global temperatures from burning fossil fuels might trigger further tipping in the Antarctic region — depending on how quickly emissions are reduced in the future.
One concerning issue is that crossing one tipping point could push another system to cross another tipping point. Such domino or cascade effects can be illustrated by a simple system of four penguins in Figure 4.
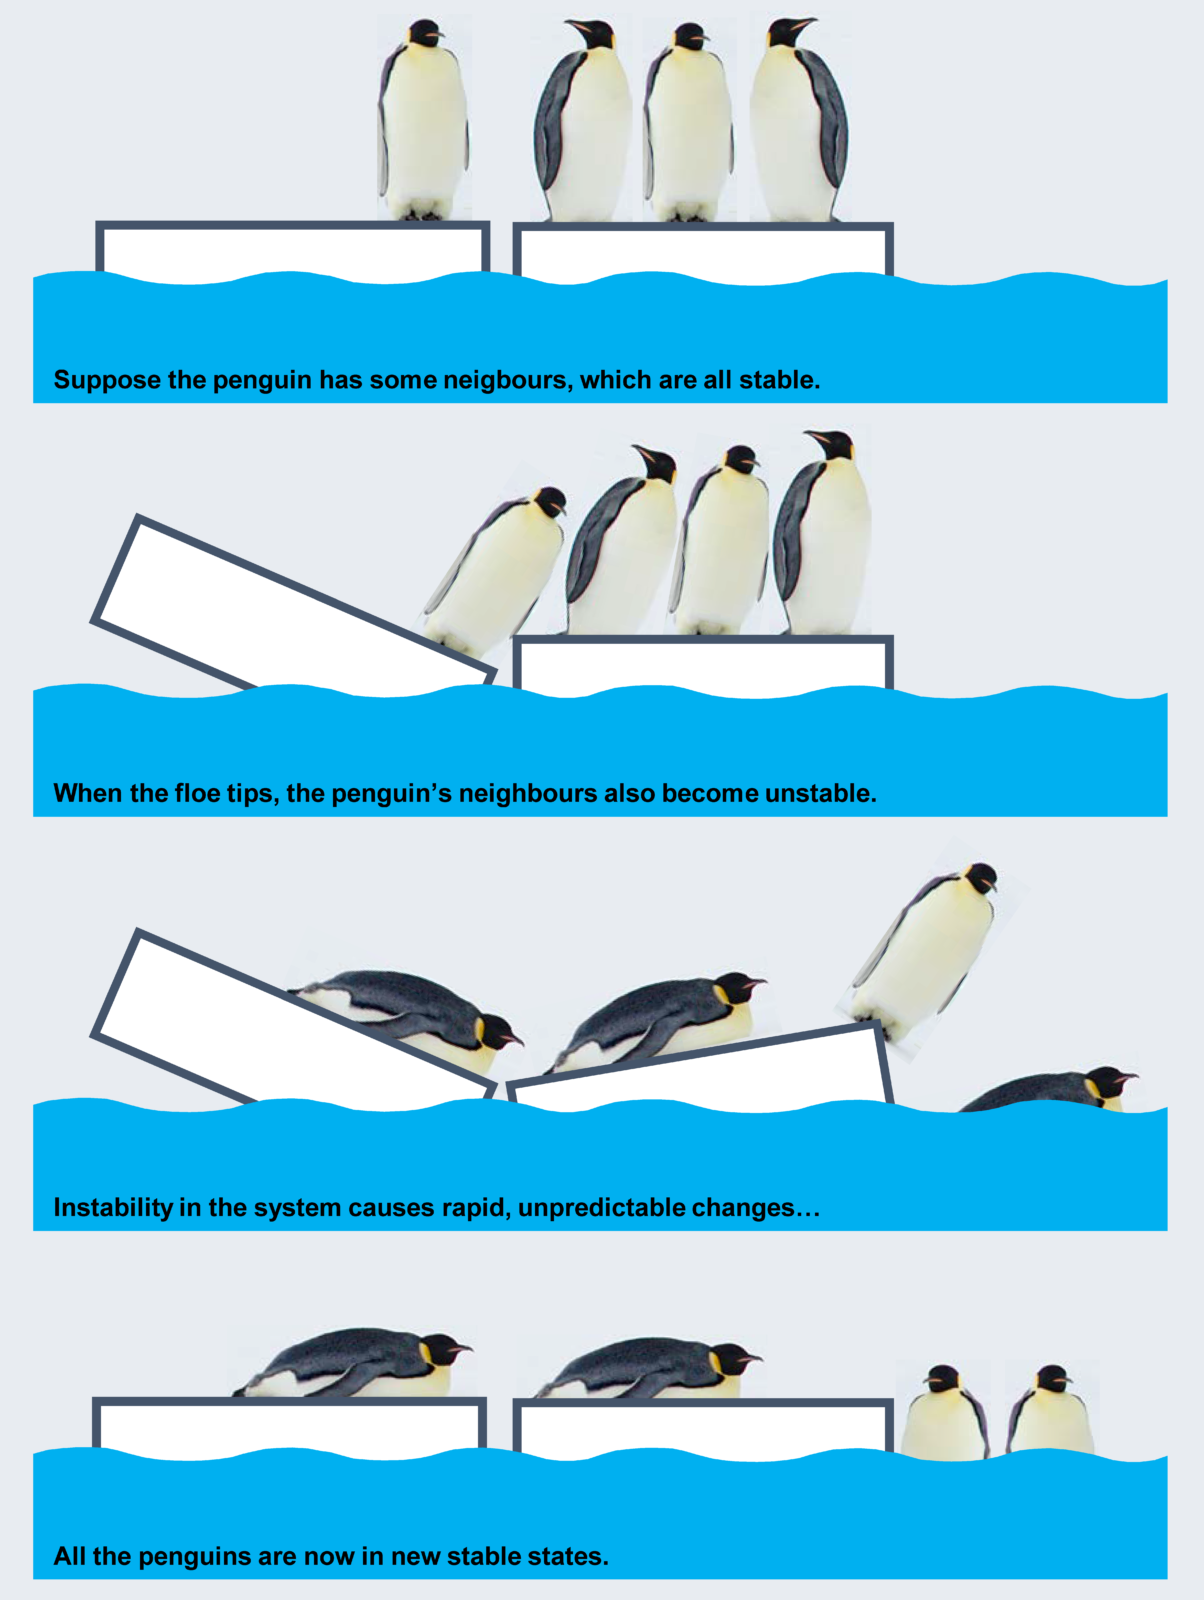
Figure 4: A simple example of complex, cascading tipping events [Credit: Ronja Reese & Dave Chandler].
This time, an instability in one part of the system triggers instabilities in other connected systems. Such a domino effect could happen if, for example, the water beneath a floating ice shelf flips from a cold to a warm state and the high rates of sub-shelf melting thin the ice shelf. If the ice shelf becomes thinner, it will be less efficient in retaining the ice flowing from the interior of the ice sheet towards the ocean (see this blog post). The ice sheet will further melt, which could then trigger the Marine Ice Sheet Instability described above! Again, the tipping ice floe could be an analogy for global warming, and the penguins could represent the Southern Ocean, floating ice shelves and the grounded ice sheet. Once one part of the system reaches a tipping point, it could trigger successive tipping points in other parts of the system. Even if global temperatures are restored to their pre-warming levels, many parts of the couple ice-ocean-climate system in Antarctica could remain in new, stable, and likely undesirable, states.
If you want to learn more about these tipping points and how they might interact, take a look at the video below created within the TiPACCs project. It requires a joint effort of polar oceanographers and glaciologists using a combination of theoretical understanding, numerical modelling and observations to understand how, if, when and how fast such events might be happening now and in the future.
Further reading
- Hysteresis of the Antarctic Ice Sheet (Garbe et al., 2020, spoiler: blog post coming soon)
- Potential tipping of the Weddell Sea (Hellmer et al., 2012; 2017)
- Some theory about the Marine Ice Sheet Instability (Weertman 1972; Schoof 2007) and the role of ice-shelf buttressing (Pegler 2018, Haseloff & Sergienko 2018)
- Tipping elements of the Earth system (Lenton et al. 2009)
- “The Tipping Point – How Little Things Can Make A Big Difference” published in 2000 by Malcom Gladwell
Edited by Andrew Smedley
 Ronja Reese is a postdoctoral researcher at the Potsdam Institute for Climate Impact Research, Germany, in the working group on Ice Dynamics and the future lab on Earth Resilience in the Anthropocene. She investigates ice dynamics in Antarctic with a focus on ice-ocean interactions, ice-shelf buttressing and ice sheet (in)stability within the DFG project GIS-TIP and the TiPACCs project (https://www.tipaccs.eu/). Contact Email: ronja.reese@pik-potsdam.de
 Dave Chandler is a postdoctoral researcher at NORCE and the Bjerknes Centre for Climate Research in Bergen, Norway, within the TiPACCs project (https://www.tipaccs.eu/). Dave’s main research interests are present & past ice sheet dynamics in Antarctica and Greenland. Contact email: dcha@norceresearch.no.