When we talk about greenhouse gases and climate change, carbon dioxide (CO2) and methane (CH4) usually receive most of the attention. Yet another gas, nitrous oxide (N2O), quietly plays an important role in our changing climate. Commonly known as “laughing gas”, N2O is a powerful greenhouse gas with nearly 273 times the warming potential of CO2 over a 100-year period. Once released, it can remain in the atmosphere for more than a century. During this time, it contributes not only to global warming but also to the depletion of stratospheric Ozone. Its atmospheric concentration has been increasing, largely due to human activities, with nitrogen-based fertilizers used in agriculture being an important contributor.
Agricultural soils release N2O mainly through two microbial processes in the nitrogen cycle; nitrification and denitrification. During nitrification, soil microorganisms convert ammonium into nitrates under oxygen-rich conditions, producing N2O as a by-product. During denitrification, microorganisms convert nitrate into nitrogen gases under low-oxygen conditions, with N2O produced as an intermediate product. Applying nitrogen fertilizers can increase these emissions by providing more nitrogen for these microbial processes. Measuring these emissions, however, is surprisingly difficult. Unlike emissions from a smokestack, agricultural N2O emissions are often spread across large areas. They can vary considerably from one part of a field to another. They can also change rapidly following fertilizer application, rainfall, or changes in soil moisture and temperature. This high variability makes N2O a particularly challenging greenhouse gas to monitor.
Ground-based instruments, such as soil chambers and eddy covariance towers, can measure N2O emissions accurately. However, their measurements are spatially limited. Measurements from a small area may not represent what is happening across an entire agricultural field or region. Imagine trying to understand a large landscape while being able to examine only a few small pieces at a time. Remote sensing offers a way to broaden that view. Instruments aboard aircraft or satellites could potentially observe much larger areas from above. But seeing N2O from above is not straightforward.
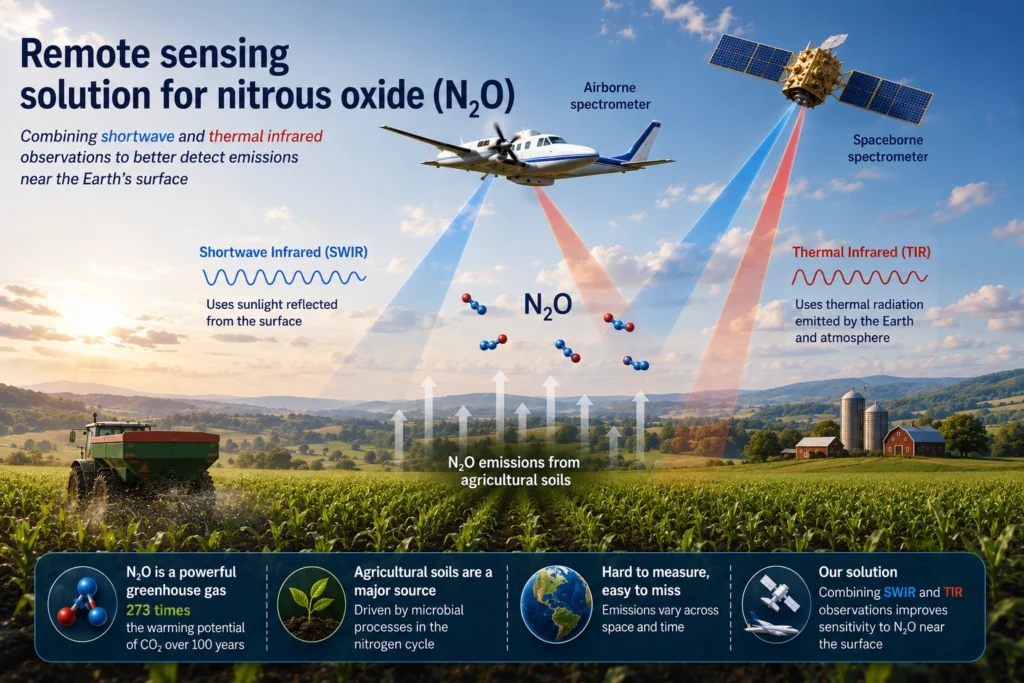
Atmospheric gases interact with radiation at specific wavelengths, leaving characteristic spectral “fingerprints”. By measuring these fingerprints, remote-sensing instruments can estimate how much gas is present in the atmosphere. N2O has useful absorption features in both the shortwave infrared and thermal infrared parts of the spectrum. These two regions provide different views of the atmosphere. Shortwave infrared measurements mainly use sunlight reflected from the Earth’s surface. Thermal infrared measurements, in contrast, use radiation emitted by the Earth and atmosphere. This difference led us to the central idea behind our study: rather than relying on only one part of the spectrum, could we combine information from both shortwave and thermal infrared measurements to better observe N2O emissions near the Earth’s surface?
The two spectral regions can be thought of as looking at the atmosphere through two different lenses. Each provides useful information, but they are sensitive to N2O in different ways. Thermal infrared observations provide valuable information about atmospheric N2O but can have limited sensitivity close to the surface. Shortwave infrared observations have weaker N2O absorption signals, but they can provide additional sensitivity near the surface. Combining the two could therefore provide a more complete picture than relying on either view alone. To explore this possibility, we used atmospheric simulations to investigate how future remote-sensing instruments might respond to N2O enhancements. We expanded the SPLAT-VLIDORT radiative-transfer modeling framework that simulates how radiation interacts with atmospheric gases and how those signals would be observed by remote-sensing instruments, to jointly simulate shortwave and thermal infrared measurements.
We applied this framework to two hypothetical instrument designs; airborne and spaceborne. Both designs are based on the grating-spectrometer approach used by MethaneAIR and MethaneSAT, remote-sensing instruments developed to detect methane signals from aircraft and space, respectively. The airborne design has a footprint of about 20 metres, while the spaceborne design has a footprint of about 0.7 kilometres. Using radiative transfer simulations, we investigated whether combining the two spectral regions could improve sensitivity to N2O near the surface. We also estimated the expected measurement uncertainty for each instrument design. Our results showed that combining shortwave and thermal infrared measurements improves sensitivity to N2O near the surface compared with using thermal infrared measurements alone. At the same time, it maintains precise measurements of the total amount of N2O in the atmospheric column. The estimated uncertainty of an individual measurement is about 3.2 parts per billion (ppb) for the airborne instrument and approximately 1.1 ppb for the satellite instrument, only about 0.3–1% of the typical N2O background concentration of around 330 ppb.
But measurement precision alone does not tell us whether an instrument could detect N2O variations under real atmospheric conditions. The signal also needs to be large enough to stand out from measurement noise. We therefore compared our simulated measurement errors with two independent real-world datasets from the US Midwest. The first dataset came from aircraft measurements collected over Iowa cropland during the MAIZE campaign in 2022. These measurements showed how atmospheric N2O varies across an agricultural landscape. The second dataset came from automated soil chambers in Illinois, which measured N2O emissions directly from agricultural soils. We used these measurements to estimate how different soil emission rates could translate into atmospheric N2O enhancements over different spatial scales.
Using the aircraft observations to determine how N2O naturally varies across space, we found that the observed N2O variability exceeded the expected measurement error at spatial scales greater than 2.5 kilometers for the airborne instrument and 22 kilometers for the satellite instrument. Examining the problem from an emissions perspective, the resulting atmospheric N2O enhancement from a representative soil emission rate of 5 nmol m-2 s-1, could become detectable over scales larger than 2.1 kilometers for the airborne instrument and 8.4 kilometers for the satellite instrument. Stronger and more concentrated emission sources may therefore be easier to identify, while detecting diffuse agricultural emissions requires the right combination of instrument sensitivity and spatial coverage.
Why does this matter? Better observations of N2O could help bridge an important gap between detailed ground measurements and the much larger spatial scales needed to understand regional and global emissions. Remote sensing would not replace soil chambers or other ground-based measurements. Instead, the approaches could complement one another. Ground observations tell us what is happening at specific locations, while aircraft and satellites could reveal how N2O varies across entire landscapes. Such measurements could ultimately help identify emission hotspots, improve estimates of regional N2O emissions, and evaluate how agricultural practices influence emissions. This is particularly important as we search for ways to maintain agricultural productivity while reducing the climate impacts associated with nitrogen use.
There is still a considerable distance between demonstrating this concept and routinely mapping agricultural N2O emissions from aircraft or satellites. The real atmosphere brings additional challenges. Clouds, aerosols, variations in the Earth’s surface, atmospheric temperature, and instrument limitations can all affect remote-sensing measurements. Future airborne observations will therefore be an important step toward testing how well this approach performs outside simulations. Our study provides a step toward defining what a dedicated N2O remote-sensing system might need to achieve. By combining information from two different parts of the infrared spectrum and connecting simulations with real atmospheric and agricultural measurements, we show a possible pathway toward observing N2O emissions at spatial scales that are difficult to capture using ground measurements alone.
N2O may be invisible to our eyes, but its influence on our climate is not. Improving our ability to see where it comes from could help us better understand, and eventually better manage, one of the less visible pieces of the climate puzzle. To dive deeper into the research, you can read our full article, “Towards a remote sensing solution to quantify nitrous oxide emissions by integrating shortwave and thermal infrared bands”, here.
This post has been edited by the editorial board
References:
1. Riaz, A., Sun, K., Baker, B. D., Buma, B., Cady-Pereira, K. E., Chan Miller, C., Eddy III, W. C., Farris, B. M., Kampe, T. U., Kort, E. A., Leisso, N. P., Spurr, R., Stuchiner, E. R., and Yang, W. H.: Towards a Remote Sensing Solution to Quantify Nitrous Oxide Emissions by Integrating Shortwave and Thermal Infrared Bands, EGUsphere [preprint], https://doi.org/10.5194/egusphere-2026-1482, 2026.