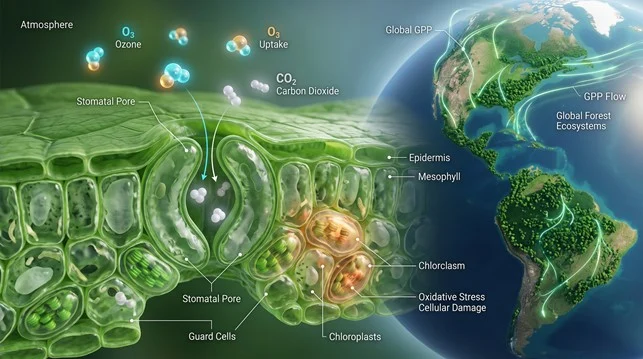
(Schematic cross-section showing leaf stomatal O_3 uptake, chloroplast oxidative stress, and the resulting downregulation of Earth’s global photosynthetic carbon uptake (GPP))
We usually think of ozone as a shield high in the atmosphere or as an air pollutant that harms human lungs near the ground. But plants also “breathe” ozone. Through microscopic pores called stomata, leaves take in carbon dioxide for photosynthesis—and ozone can enter through the same doorway.
Once inside a leaf, ozone forms reactive compounds that disrupt photosynthesis and alter stomatal behaviour. At the scale of a single leaf, this is a physiological stress response. At the scale of the planet, it can affect gross primary production (GPP): the total amount of carbon plants take up through photosynthesis. Because GPP is one of the largest carbon flows in the Earth system, even modest errors in its representation can influence how we understand the land carbon cycle.
Yet there is a complication. Land-surface models do not all translate ozone exposure into plant damage in the same way. Our recent study in Geoscientific Model Development asked a simple but consequential question: if the same land model sees the same weather and the same ozone, how much do its answers depend on the mathematical “rules” used to represent ozone stress?
From ozone in the air to ozone inside a leaf
Ambient ozone concentration alone does not tell us how much damage a plant experiences. Ozone must first reach the leaf surface and then pass through the stomata. Uptake therefore depends on wind and turbulence, leaf boundary layers, stomatal opening, light, temperature, humidity, and soil water availability. A dry plant may close its stomata and take up less ozone even when the surrounding concentration is high; under brighter and wetter conditions, open stomata may admit a larger dose.
Models handle this pathway with an ozone-stress parameterization: a compact set of equations that decides three things. First, how much ozone enters the leaf? Second, does the flux exceed a damage threshold? Third, how does accumulated exposure suppress photosynthesis and stomatal conductance—and how quickly does the plant “forget” earlier exposure as leaves turn over or conditions change?
These choices may sound technical, but they encode very different biological assumptions. A single threshold applied to all vegetation treats forests, shrubs, grasses, and crops as if they tolerated ozone similarly. A linear response assumes that each additional unit of ozone dose causes the same increment of damage. A strong memory term can allow injury to accumulate for too long, while a rapid decay can underestimate persistent stress.
The modelling comparisons and validation inside CLM5
To isolate these choices, we implemented and compared three widely used ozone-stress schemes—Sitch, Lombardozzi, and Li—within the Community Land Model version 5 (CLM5). All simulations used a common model configuration, meteorological forcing, and hourly near-surface ozone fields for 2005–2014. We also designed mixed experiments that placed thresholds and response functions from the older schemes inside the Li framework. These mixed runs were not recalibrated; their purpose was diagnostic, allowing us to trace differences to model structure rather than to unrelated settings.We then compared simulated GPP with two complementary observational benchmarks. MODIS provides broad satellite-based coverage, while FLUXNET towers measure exchanges of carbon between ecosystems and the atmosphere at individual sites. The two views are not interchangeable: satellites offer spatial reach, whereas flux towers provide process-rich, high-frequency observations. Together, they allow a more demanding evaluation across latitude bands, biomes, seasons, and plant functional types. The same ozone for very different global losses Every ozone scheme reduced global GPP relative to a simulation without ozone stress—but by very different amounts. The no-ozone experiment produced 132.0 petagrams of carbon per year. The Li scheme reduced this total by 12.8%, to 115.14 petagrams of carbon per year, close to independent global benchmarks. The Lombardozzi scheme reduced GPP by 23.5%, to 100.98 petagrams of carbon per year. In other words, the estimated loss differed by more than a factor of two even though the atmospheric forcing and host land model were held constant.
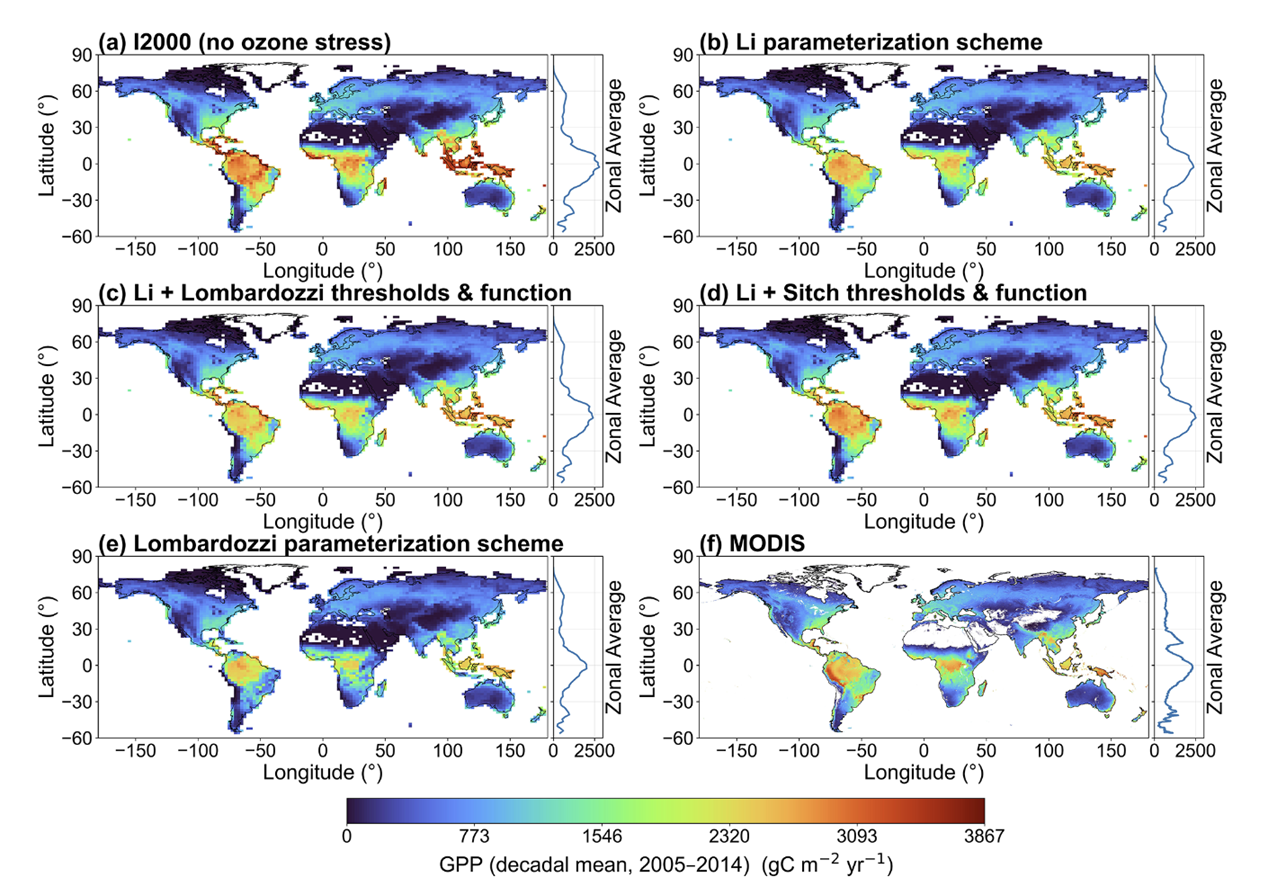
Figure 2. Spatial patterns and zonal gradients of decadal-mean gross primary production (GPP).
(Global distribution of decadal-mean (2005–2014) GPP and corresponding zonal-mean profiles simulated by CLM5 under: (a) the ozone-free baseline (I2000), (b) the Li parameterization scheme, (c) Li framework with Lombardozzi thresholds and function, (d) Li framework with Sitch thresholds and function, (e) the Lombardozzi parameterization scheme, and (f) the MODIS satellite benchmark. Neglecting ozone stress leads to marked tropical GPP overestimation, while different ozone schemes produce distinct spatial constraints. Adapted from Fig. 1 of Zhou et al. (2026), licensed under CC BY 4.0.)
The contrast was clearest in high-flux regions. The Lombardozzi formulation accumulated ozone damage strongly and retained a longer memory of exposure, leading to pronounced suppression in low latitudes. The Li formulation used vegetation-specific flux thresholds, separate nonlinear responses for photosynthesis and stomatal conductance, and damage decay linked to leaf turnover. Among the ozone schemes, it showed the most consistent agreement with observed GPP patterns across annual, seasonal, and monthly scales.
That result does not mean that adding ozone automatically fixes a land model. In several temperate and boreal ecosystems, the no-ozone baseline already matched FLUXNET better than the ozone-stress experiments. Ozone stress can correct an existing overestimate in one region while worsening an underestimate elsewhere. The apparent success of a parameterization therefore depends on the host model’s baseline behaviour, including its treatment of canopy physiology, phenology, water limitation, and sub-grid vegetation diversity.
Where should the next generation of models go?
Our comparison points to a broader lesson: representing ozone is necessary, but the form of that representation should be dynamical. Future schemes should move beyond one-size-fits-all thresholds. They should allow ozone sensitivity to vary among vegetation types and regions, represent photosynthesis and water loss separately, and connect damage and recovery to leaf age, canopy structure, phenology, and soil moisture.
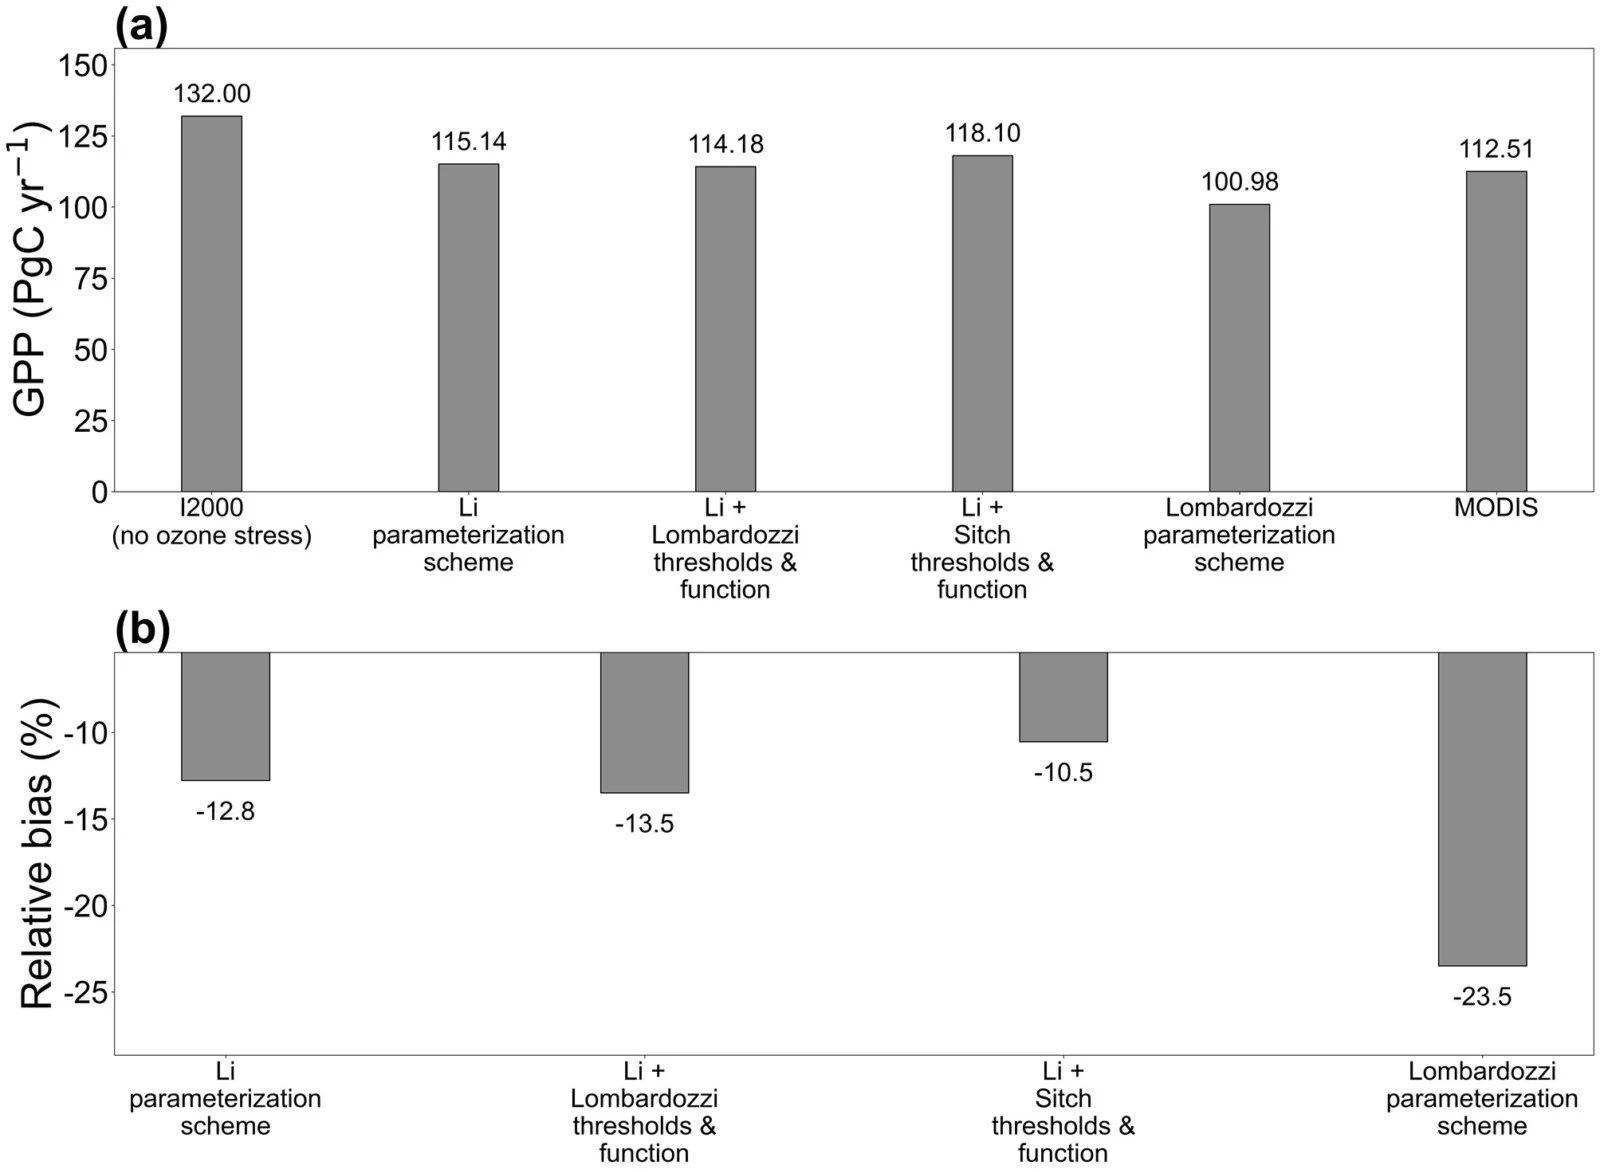
Figure 3. Global total GPP for the no-ozone simulation, four ozone-stress experiments, and MODIS (top), and the relative GPP reduction caused by each ozone scheme (bottom). Adapted from Fig. 10 of Zhou et al. (2026), licensed under CC BY 4.0.
Better observations will be central to this effort. Flux towers and satellite products can constrain different parts of the problem, while ozone fumigation experiments provide direct evidence of how plant species respond. Emerging measurements of canopy structure and plant traits may eventually help models replace broad vegetation categories with more continuous, biologically meaningful controls.
The stakes extend beyond model elegance. Surface ozone changes with emissions, atmospheric chemistry, weather, and climate. If models misrepresent how plants take up ozone or recover from it, they may misjudge ecosystem productivity and the strength of the terrestrial carbon sink. Our results show that uncertainty does not come only from how much ozone is in the air. It also comes from what the model believes happens after ozone reaches a leaf.
This blog post is based on a manuscript accepted for publication in Geoscientific Model Development.
This post has been edited by the editorial board
References:
1. Zhou, P. et al. (2026). “Benchmarking ozone stress parameterizations in CLM5: a global mechanistic assessment of thresholds and memory effects.” Geoscientific Model Development, 19, 5491–5513. https://doi.org/10.5194/gmd-19-5491-2026