Availability of good quality data is essential to deduce meaningful information in all disciplines of science and technology. This statement is especially relevant in climate research, which is under constant scrutiny from sceptics. In order to better understand the Earth system response to the ongoing anthropogenic global warming, we require global observations of climate indicators at very high spatiotemporal resolutions. In a perfect world, every country provides a dense observation network and shares its data openly for research. Yet political and financial constraints prohibit this reality.
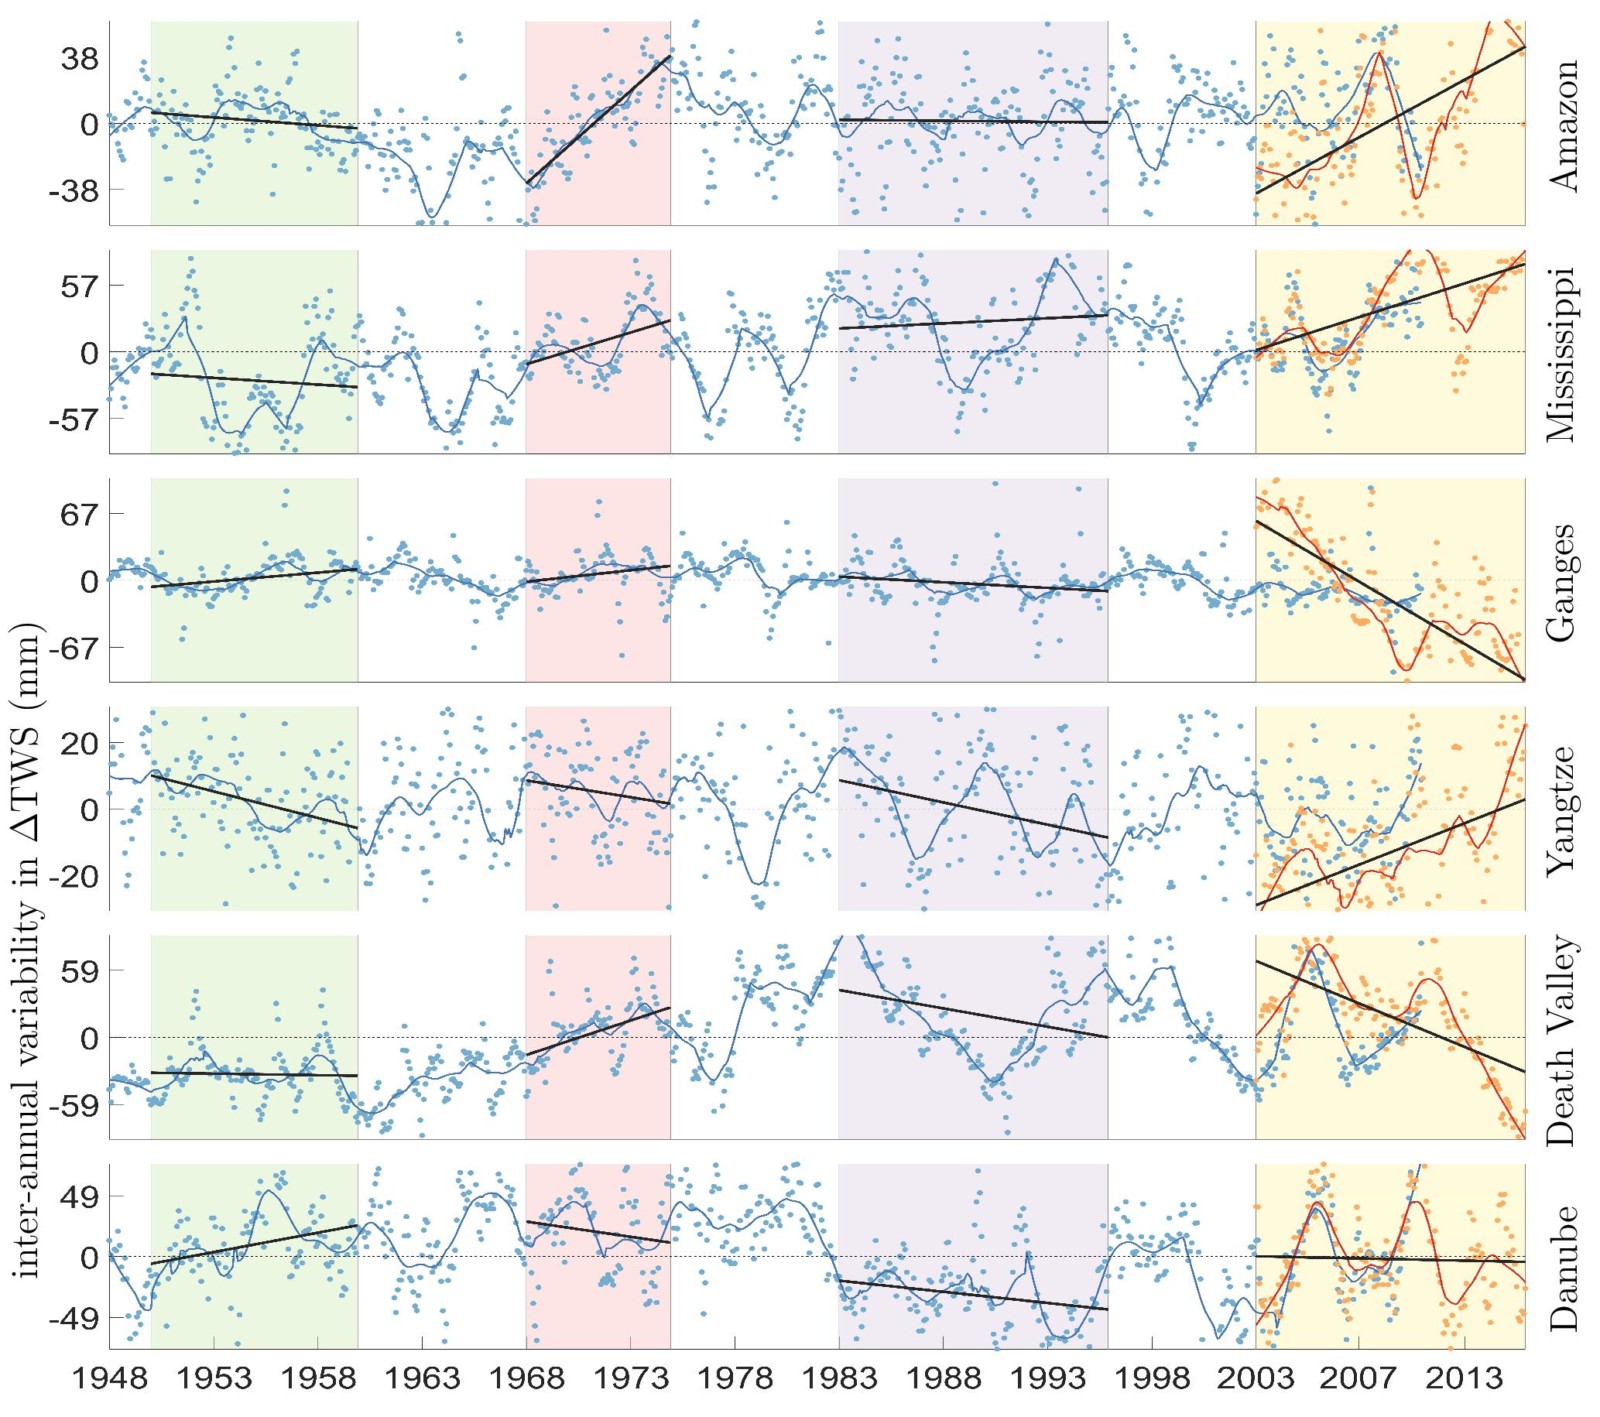
Figure 1: Natural water mass change time series for few river catchments from a land surface model (blue dots and line) and Terrestrial water storage change (TWS) from GRACE data (orange dots and red line). Dots represent the signal after removing the dominant seasonal signal and the linear trend in a time frame (shaded colours) is shown by the black line. It is evident that short time series can suggest strong change while it would have been driven by natural variability.
Hence, the era of satellite-based Earth observation has been a revolution for geosciences. The launch of satellites that observe our planet since the 1970s, such as optical remote sensing satellites, satellite altimetry launched in the early 1990s followed by the gravity recovery and climate research (GRACE) missions in 2002, provided a much needed momentum to climate change research. Most importantly, GRACE has been a game changer. It consists of two satellites, separated by 220 km with one behind the other in the same near-polar orbit, and by measuring changes in the distance between the two satellite with micro-meter precision, we are able to map the changes in the gravity field of the Earth from one month to the other. These very small changes in local gravity field are driven by mass redistribution in the Earth system. For example, if it rains heavily and the water is collected in an adjacent (sub-surface or on surface) water body, an increase in mass is recorded in the gravity data from the satellite. Similarly, for droughts or ice-sheet melting, a mass loss perturbs the gravity field and will be recorded by the satellite mission. As a result, GRACE data has been used in nearly all the disciplines of Earth sciences where we are concerned with mass redistribution. However, the impact of GRACE on hydrology is unmatched.
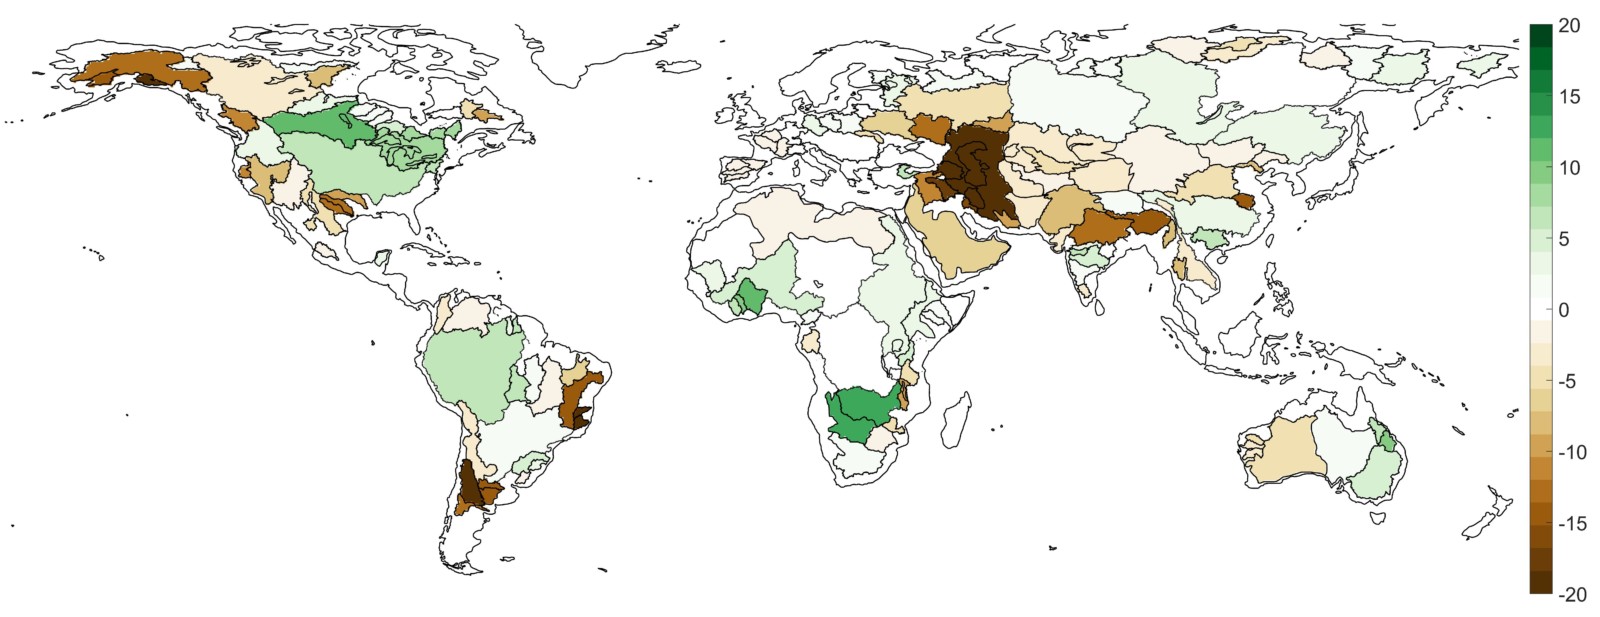
Figure 2: GRACE observed water mass change trends (in mm/yr) between 2003 and 2015. Brown represents loss and green represents gain.
GRACE data has been abundantly used in research studies that want to capture a long-term water mass change, such as diminishing water bodies, droughts, and so on. The popular approach has been to first decompose the GRACE time series into seasonal signals and a linear trend, then by assuming that the magnitude of trend is directly proportional to the severity of water mass change, where regions with strong trends are investigated for the driving process (human-driven or climate change driven or extreme events). Since GRACE data covers less than two decades, any long term (multidecadal) natural hydrological variability would appear in the linear trend estimates (see Figure 1). Furthermore, different regions have different natural variability cycles, for example, the ups and downs in water availability over a year in part of the Middle East (that is usually very arid) can be much smaller than in the Europe. This makes a comparison of trends between two regions very difficult. Hence, understanding the severity of linear trend obtained from a short time series, when the driving processes has a cyclic behaviour that lasts more than a decade can be challenging. This problem has been addressed in a recently published article, where the authors propose a new metric to interpret the strength of trends with respect to long term natural spatiotemporal variability: Trend to variability ratio (TVR). It normalizes the total change in water mass in a region with the standard deviation of multidecadal natural hydrological variability obtained from simulations. In Figure 2, the linear trends from GRACE data are shown and in Figure 3, the TVR is shown. It is evident that the trend map and the TVR map are significantly different. From the TVR map, one can demarcate several regions that are losing water at an unprecedented rate, however, these regions are labelled to be non-alarming in the trend map (Fig. 2). Such observation is significant, because it is estimated that more than 3.2 billion people reside in regions that are experiencing severe water loss in comparison to natural hydrological variability in the last four decades.
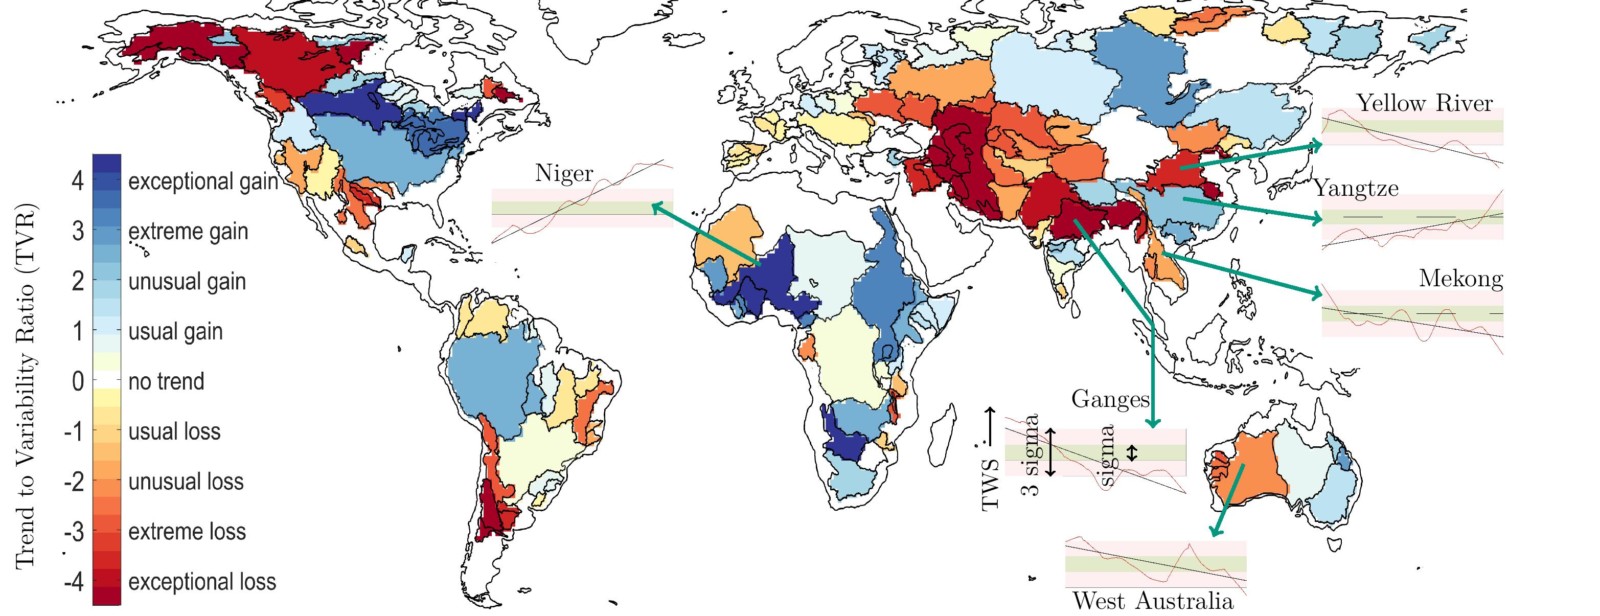
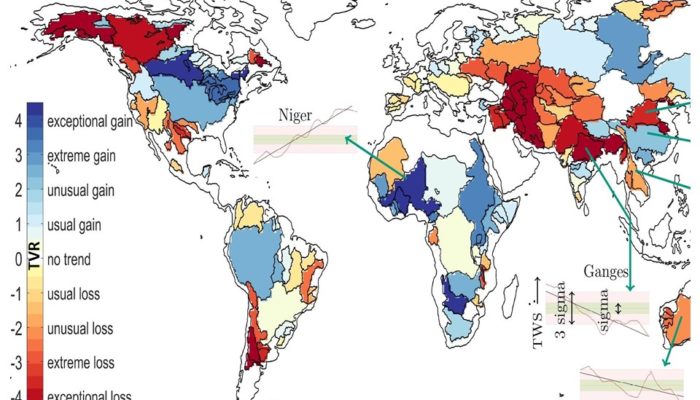
Figure 3: TVR map. The time series for a few catchments illustrates the concept. The green band is the one standard deviation of natural variability, and the pink band is 3 times the standard deviation. The red line is the interannual variability and black line is the trend. Wherever the total change exceeds more than 3 times the standard deviation of multidecadal (40 years in this case) natural variability, that region is highlighted as either dark blue of dark red.
TVR is an excellent tool for analysing the severity of short time series from other observational datasets. For example, TVR could be used to investigate if the sea level rise in the three decades is unprecedented with respect to that observed in the last few centuries. Similarly, one could apply TVR to global mean temperature data to show that the change in global temperature in the last 50 years is significantly more than anything we have experienced in the last thousand years. The application of TVR is not limited to geosciences and one may use it in any discipline that wants to better capture and compare the seriousness of secular change that has been captured in short time series, if simulations that capture the long-term natural variability are available.
This post has been edited by the editorial board.
References
Vishwakarma, B. D., Bates, P., Sneeuw, N., Westaway, R. M., & Bamber, J. L. (2021). Re-assessing global water storage trends from GRACE time series. Environmental Research Letters, 16(3), 034005.