Beneath the serene landscapes we inhabit, the Earth’s crust is a battleground of constant, immense, and invisible tectonic forces. While humanity typically only notices this deep-seated stress when it violently releases in the form of an earthquake and volcanoes, these forces have always been shaping the structural bedrock of our planet. Understanding this hidden architecture is one of the most vital and formidable tasks in modern geosciences. Recently, researchers Oliver Heidbach and Mojtaba Rajabi published a landmark paper in the journal Solid Earth where they detail the 2025 release of the World Stress Map (WSM).
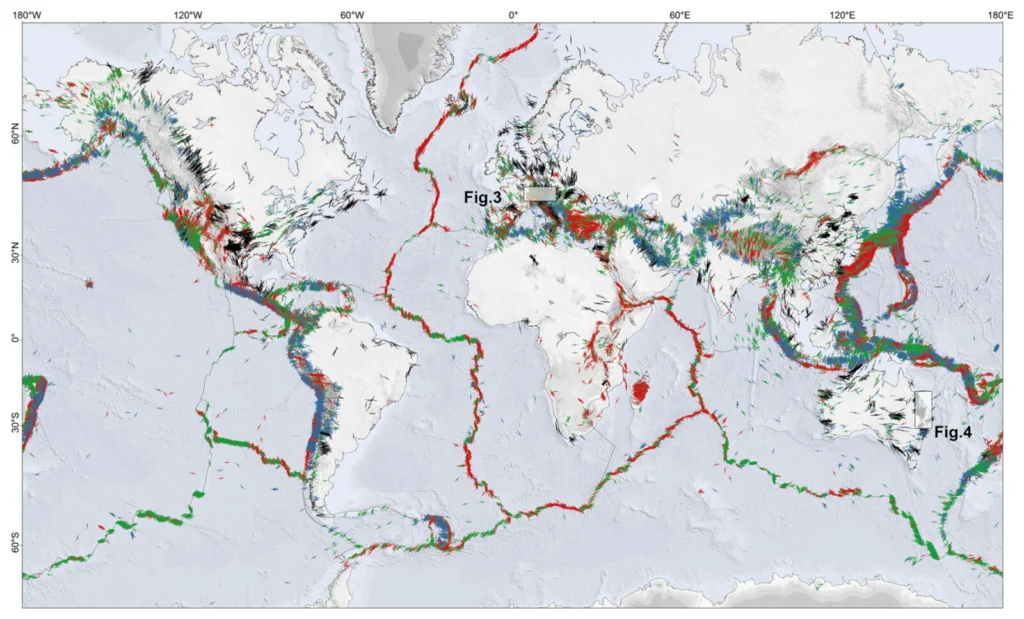
Marking the project’s 40th anniversary, the paper, titled “Patterns of contemporary horizontal stress orientation in the Earth’s crust derived from the World Stress Map Database 2025”, represents a massive leap forward in our understanding of planetary geodynamics. This latest release provides a high-resolution view of… basically how the Earth’s crust is being squeezed horizontally (referred to as maximum horizontal stress SHmax) across the globe. The scientists who authored this paper compiled and analysed 100,842 quality-ranked data records, and have therefore more than doubled the data available from the previous 2016 release. This uncovered unprecedented scientific insights into how, where, and why the Earth’s crust bends and yields
The foundation of a sustainable future
At first glance, mapping the orientation of stress deep underground might seem like a purely academic exercise. However, knowledge of the present-day stress field is a fundamental prerequisite for applied research and modern subsurface engineering. On a macro level, it is essential for understanding large-scale geodynamic processes, tracking global plate tectonics, and decoding the mechanisms behind destructive earthquakes. But beyond Earth sciences, understanding crustal stress is becoming increasingly urgent for humanity’s transition to more sustainable economies. As we keep leveraging the subsurface for green energy solutions, such as the exploration of deep geothermal reservoirs and the development of large-scale geo-energy storage, new engineering concepts place heavy demands on geomechanical integrity. Engineers must, therefore, ensure the long-term stability of these reservoirs; it is impossible to safely drill, fracture rock, or store thermal energy deep underground without knowing the precise directions of the forces acting upon those rock formations. In addition to this, crustal stress data is a critical safety parameter for the design of deep geological repositories intended for radioactive waste. These important facilities are typically planned at depths between 400 and 1,000 meters. What’s important about this paper is that it also highlights that stress regimes change significantly with depth. Near the surface, horizontal stress magnitudes are frequently larger than the vertical stress (which is controlled solely by gravity), which leads to a thrust faulting stress regime. As depth increases to the zones where earthquakes typically nucleate, these regimes can shift entirely. These changes in the stress regime with depth have a direct impact on the structural design of underground tunnels and storage caverns, and this makes high-resolution stress mapping quite a necessity to ensure environmental and public safety over millennial timescales.
A paradigm shift in geodynamics
Perhaps the most exciting scientific breakthrough from the 2025 WSM database is how the volume of new data has upended a long-standing geological hypothesis. When the WSM project was initially launched in 1986 as a task force of the International Lithosphere Program, its primary objective was to test a hypothesis proposed by Voight in the mid-1960s. Voight posited that the orientation of the maximum horizontal stress in the Earth’s crust is predominantly controlled by massive, large-scale plate tectonic forces. For decades, early maps with fewer data points broadly supported this idea, suggesting that stress orientations generally followed the direction of relative plate motions. However, the unprecedented density of the new 2025 dataset proves that this traditional hypothesis must be revised. By estimating SHmax orientations on regular global grids using search radii between 50 and 500 kilometers, the authors concluded that in intraplate regions, which are areas far from the active edges of tectonic plates, there are substantial and dramatic rotations in the orientation of SHmax. In other words, rather than being entirely dictated by uniform plate boundary forces, the stress field in these regions is significantly influenced by second-order effects, such as lateral variations in rock stiffness, density contrasts, and the gravitational potential energy generated by high topography.
The paper provides evidence of these localised stress rotations. In the Alpine foreland of central Europe, for instance, the SHmax orientation rotates by approximately 50 degrees, shifting from a north-south alignment in the east to a northwest-southeast alignment in the western Alps. Even more striking is the high-density data emerging from eastern Australia. When they applied a 50-kilometer search radius on a global grid, the authors demonstate that the stress orientation in regions like the Surat Basin rotates by more than 50 degrees over distances of less than 100 kilometers.
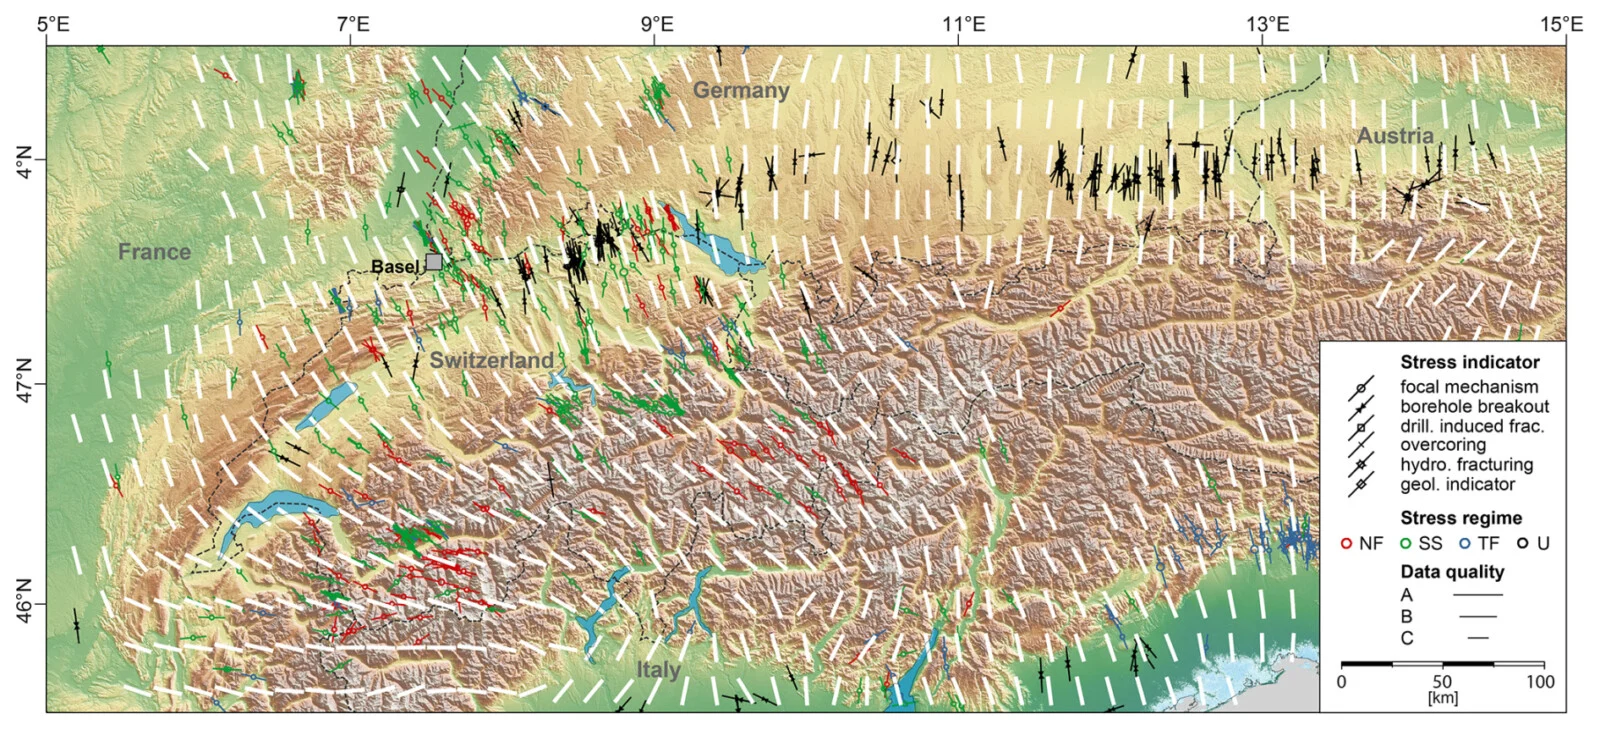
Stress map of the Alpine foreland. Black and coloured lines indicate data records of the orientation of maximum horizontal stress (SHmax) with A–C quality. Line length is according to data quality and their colours mark the stress regime with red for normal faulting (NF), green for strike-slip faulting (SS), blue for thrust faulting (TF), and black for unknown stress regime (U). White bars on the 0.2° grid show the dataset of the mean SHmax orientation with a search radius of 50 km. Dashed black line denote the national boundaries.
These gradual rotations occur even in areas that lack massive topographic mountains and do not necessarily correlate with local fault lines. If we look at a dense dataset of 680 vertical boreholes in the northern Bowen Basin of Australia, we can see uniform stress over a 30,000 square kilometer area despite the presence of faults! Yet just further south, the stress orientation rotates up to 60 degrees. This suggests that in regions where the horizontal differential stress is low, regional topography and local rock stiffness step up to take the wheel and override the massive, continent-shifting forces of plate tectonics.
This paradigm-shifting observation was only made possible by the fascinating methodological advancements of the WSM 2025 release. The history of stress measurement dates back to the 1930s with surface relief methods, evolving through the 1950s with flat jacks, the 1970s with hydraulic fracturing and borehole breakouts, and the rapid expansion of global seismological networks. To integrate these different stress indicators, the scientists rely on a quality-ranking scheme. For the 2025 release, the authors overhauled this quality-ranking system to make it machine-readable and compatible with a new Python-based database infrastructure known as MaRS (Management and Repository of Stress). They discarded rarely used or unverified indicators, refined the strict mathematical rules for assigning data quality (ranging from A to E based on standard deviation), and introduced new depth and distance requirements.
From orientation to magnitude
So, what is the next frontier for the World Stress Map? While the 2025 release provides an incredibly detailed, high-resolution map of stress orientation, the geosciences engineering community is looking to quantify the complete, three-dimensional stress tensor. The authors note that the newly documented local rotations in SHmax orientation will serve as proxies to calibrate complex 3D geomechanical-numerical models. These advanced models will finally allow scientists to quantify the relative contributions of continent-pushing plate boundary forces versus localised crustal stiffness. This research will have significant implications for evaluating tectonic fault criticality, which means predicting how close a fault is to slipping, which itself is a safety concern for the energy transition.
However, to perfect these predictive geomechanical models, scientists need more than just the direction of the Earth’s stress: they need to know its accurate physical power! In regions where the SHmax orientation is uniform, or where data coverage remains sparse, stress magnitudes become the essential missing puzzle piece for model calibration. Initial efforts are already underway to compile an open-access database of stress magnitudes, starting with a pilot focused on Germany and its neighboring countries.
Final thoughts
The 2025 release of the World Stress Map is a significant re-evaluation of the immense forces that shape our world. Thanks to their work, Heidbach and Rajabi have now armed modern researchers, engineers, and policymakers with the open-access tools necessary to safely navigate the deep subsurface. Whether we are modeling the mechanics of the next major earthquake, drilling geothermal well to power a green city, or designing a repository to safely bury hazardous waste for millennia, the World Stress Map makes sure that humanity is no longer operating in the dark. As the project looks toward its next evolution, mapping the magnitudes of these invisible forces, we edge ever closer to mastering this restless crust we call home.