
Global Navigation Satellite Systems (GNSS) are best known for positioning, navigation, and monitoring Earth surface motions with high precision (see two of our previous posts on GNSS here and here). But did you know that the same satellite signals can also provide information about snow, soil moisture, or sea level, without installing any additional instruments?
This idea lies at the heart of GNSS Interferometric Reflectometry (GNSS-IR). What may initially sound like a specialised remote sensing technique is, in fact, a clever reinterpretation of signals that GNSS was never designed to observe.
When “bad signals” become useful
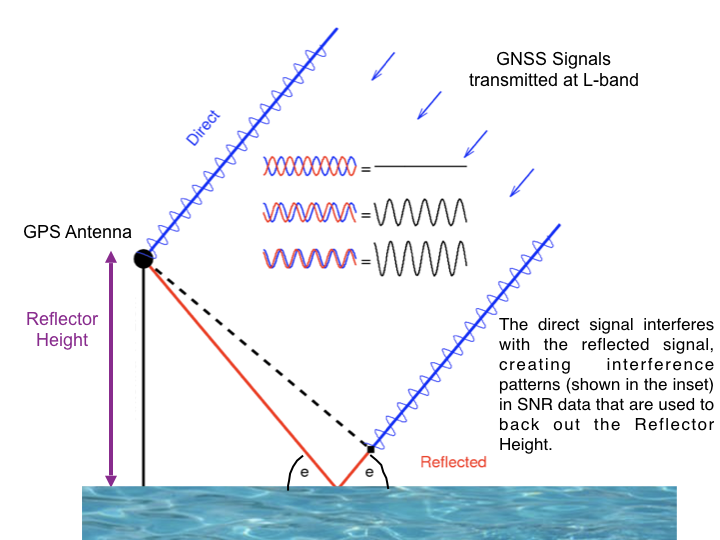
As explained in previous posts, GNSS positioning relies on electromagnetic signals sent from satellites to ground receivers. However, due to objects and surfaces in the environment of the receiver instrument (e.g., buildings, vegetation, ground or water bodies), the instrument might also receive reflections (or “echoes”) of this signal in addition to the direct signal emitted by the satellite (Fig. 1).
When signals reach a receiver both directly and after reflecting off nearby surfaces, they interfere and introduce errors. This is referred to as the “multipath effect”. Considerable effort has been devoted over many years to mitigating this multipath effect in positioning applications.
GNSS-IR takes the opposite view. Instead of suppressing multipath, it uses it as a source of information. The key observable is the signal-to-noise ratio (SNR), a variable that defines the intensity of noise in relation to the intensity of the signal. As satellites rise or set, the changing path difference between direct and reflected signals produces oscillations in the SNR time series. The frequency of these oscillations is linked to the distance between the antenna and the reflecting surface, commonly referred to as the reflector height. Analysing these patterns allows changes in the surrounding environment to be inferred (Fig. 1).
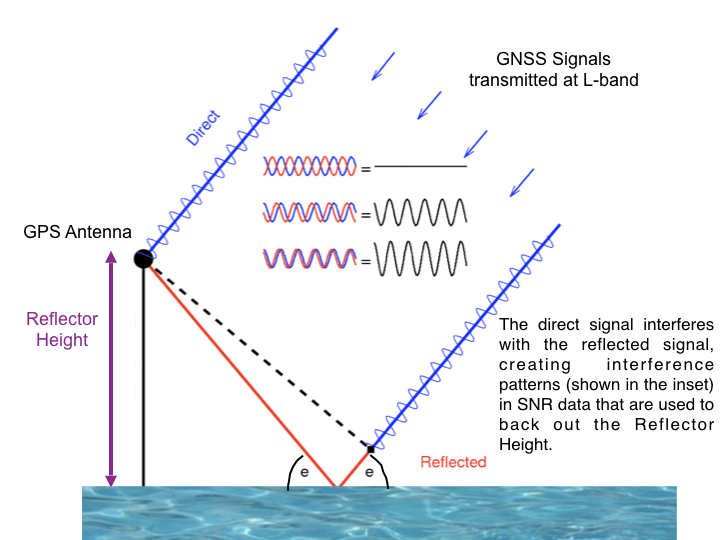
Fig. 1: Illustration of the GNSS-IR principle using signal interference to determine reflector height. Source: K. Larson, https://gnss-reflections.org/static/images/overview.png.
Measuring changes from land surfaces to the coast
How can these oscillations be used to infer information on the environment of the GNSS receiver? The principle is simple. Over the coast, changes in sea level modify the reflector height and therefore the SNR oscillation pattern. Analyzing these SNR oscillations can therefore provide information on sea level changes. Over land, snow accumulation, soil moisture variations, or vegetation can leave similar signatures in the reflected signal and can hence also be tracked through GNSS-IR.
GNSS-IR relies entirely on existing GNSS infrastructure that is already operating worldwide. This makes it particularly attractive for environmental monitoring, as no dedicated sensors or transmitters are required. In fact, since its first demonstrations nearly two decades ago, it has been successfully applied to measure changes in all of the natural elements described above, complementing established techniques such as tide gauges and satellite radar altimetry.
In coastal settings, GNSS-IR is especially useful. Tide gauges provide high temporal sampling but are affected by vertical land motion and uneven global distribution. Satellite altimetry offers global coverage but performs less reliably close to the coast (read more about satellite altimetry in one of our previous posts here). GNSS-IR fills part of this gap by providing local sea level estimates with comparatively high temporal and spatial resolution at many existing coastal GNSS stations (Fig. 2). In some cases, long archives of GNSS data can even be reprocessed to study past sea level variations.
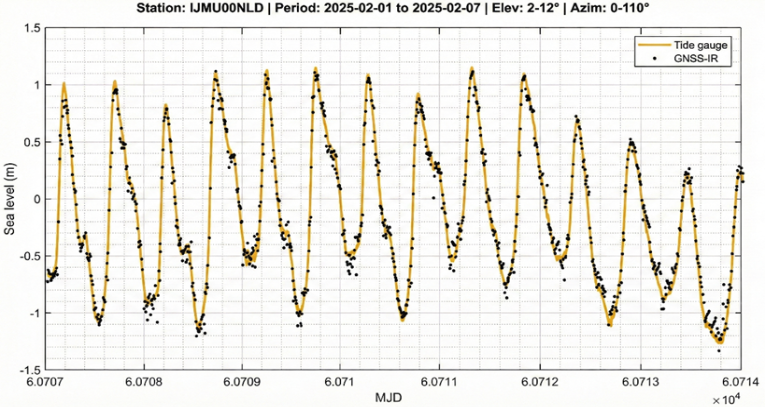
Fig. 2: An example of GNSS-IR sea level estimation comparing solutions versus tide gauge data at station Ijmuiden, Netherlands (IJMU00NLD) (2025-02-01 to 2025-02-07). GNSS-IR solutions (black dots) were obtained using the WinLSP method within an elevation range of 2°–12° and an azimuth range of 0°–110°, showing strong agreement with the reference tide gauge (orange line). The data was processed using a 1-hour sliding window shifted every 10 minutes. Outliers were removed based on standard deviation thresholds for height (<0.2 m) and height rate (<0.5 m/h).
GNSS-IR in practice
Despite its conceptual simplicity, GNSS-IR is not a push-button technique. Several factors can challenge or facilitate these measurements:
- Reflection geometry: Useful reflections are limited to specific satellite viewing angles and directions that depend on local topography. Some stations remain challenging regardless of how much data is available. For example, a station surrounded by buildings or steep terrain may block the low-angle signals that GNSS-IR relies on most.
- Surface characteristics: GNSS-IR performs best near wide, relatively flat, and stable reflecting surfaces. Over land, open and homogeneous areas are favourable, while coastal applications require an unobstructed view of the sea.
- Signal diversity: Not all satellite signals perform equally well for reflectometry. Different signal types show varying sensitivity to reflections, and increasing the number of satellites or frequencies generally improves robustness, but does not compensate for poor site geometry.
- Receiver and antenna setup: The hardware used at a station can strongly influence the quality of reflected signals. Recording data at higher rates can improve results, especially at sites with larger antenna heights. It is also essential that signal strength information is retained in the observation files, as this is the primary input for GNSS-IR analysis.
- Site documentation: Photographing the station environment is a simple but valuable step. It helps assess whether a site is suitable for GNSS-IR and guides the selection of appropriate analysis parameters.
Strengths, limitations, and why GNSS-IR matters
GNSS-IR does not replace tide gauges or satellite altimetry. Instead, it complements them.
Its strengths include low cost, flexible deployment, and the ability to reuse existing GNSS data streams. Importantly, GNSS-IR does not require high-end geodetic equipment. Low-cost GNSS receivers and even smartphones, which are usually more affected by multipath and therefore less suitable for precise positioning, can be advantageous for reflectometry. Stronger multipath signatures often make reflected signals easier to detect and analyse.
Open-source software further enhances accessibility. Community-driven tools such as the MATLAB based GIRAS package and the Python toolbox gnssrefl support a wide range of GNSS-IR analyses, lowering the entry barrier and improving transparency and reproducibility.
More broadly, GNSS-IR illustrates a recurring theme in geodesy. Signals often contain more information than initially expected. By rethinking what was once treated as an error, GNSS-IR turns unwanted reflections into a valuable source of environmental information.
So next time a GNSS receiver struggles with multipath, it may be worth listening more closely. Those reflections could be telling a story about the world beneath our feet.
Further reading
For those interested in learning more about GNSS-IR, the following resources provide a good starting point:

Larson, K.M., 2016. GPS interferometric reflectometry: applications to surface soil moisture, snow depth, and vegetation water content in the western United States. WIREs Water 3, 775–787. https://doi.org/10.1002/wat2.1167

Larson, K.M., Williams, S.D.P., 2023. Water level measurements using reflected GNSS signals. IHR 29, 66–76. https://doi.org/10.58440/ihr-29-2-a30

For an interactive introduction to the technique, visit gnss-reflections.org.
– Edited by: Leire Retegui-Schiettekatte