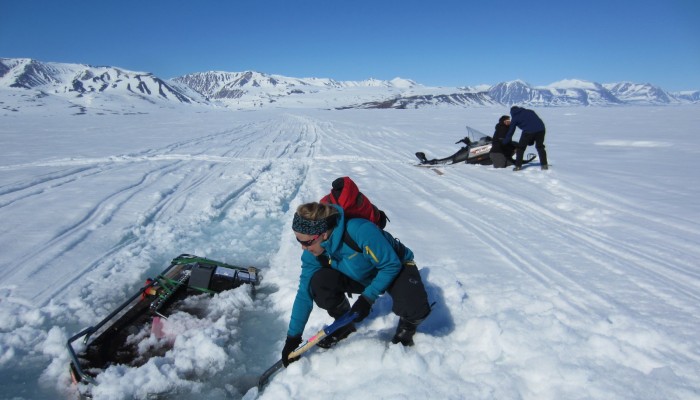
Many glaciologists look forward to going on fieldtrips and then, once they are back, they make us dream by posting breathtaking photos (like THIS or THIS or THIS). However, the reality of the field can sometimes be very different…. The picture illustrates how difficult it can be to work on sea ice when the snow on top of it starts to melt and forms slush (a mixture of snow and liquid water t ...[Read More]
Image of the Week — Future Decline of sea-ice extent in the Arctic (from IPCC)
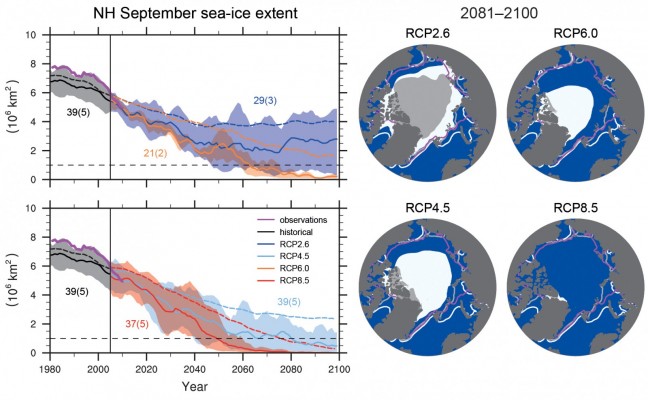
The Arctic sea-ice extent has declined in the past 20 years and its future is uncertain. In the end, greenhouse gas emissions will determine the impact on the sea-ice from man-made climate change through radiative forcing (i.e. Representative Concentration Pathways or RCPs). The COP21 can determine the path we will follow and which course we will take to reduce emissions. Reduction in sea-ice cove ...[Read More]
Image of the Week: Under the Sea
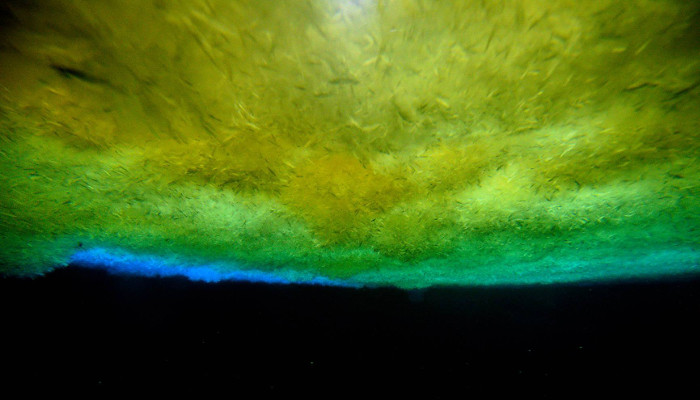
Always wondered how it looks like under the sea ice? Getting an answer is simpler than you might think: Just go out to the front of McMurdo ice shelf in Antarctica and drill a tube into the sea ice. Then let people climb down and take pictures of the ice from below. More information: – Photo taken by Marcus Arnold, Gateway Antarctica, University of Canterbury during his November 2015, Antarc ...[Read More]
Image of the Week — What’s up with the sea-ice leads?
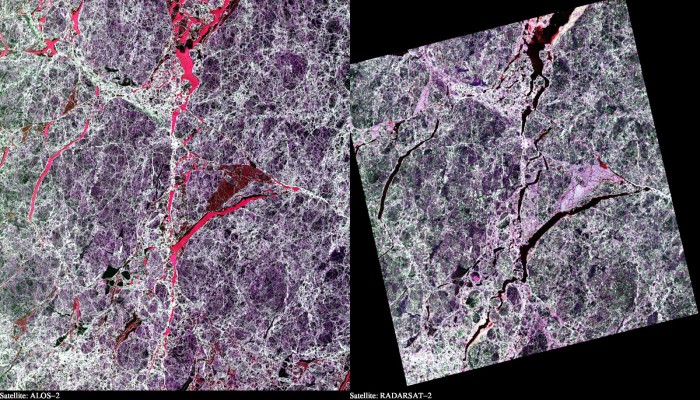
This illustration shows two Synthetic Aperture Radar (SAR) images taken over sea ice in the Arctic Ocean. Both images are polarimetric and the different colours reflect the different polarimetric channels of the SAR (red = VV, green = HV and blue = HH). The two images are from the two satellites “ALOS-2” and “RADARSAT-2”. These are equipped with radars that operate at wavel ...[Read More]
Camping on the Svalbard coast
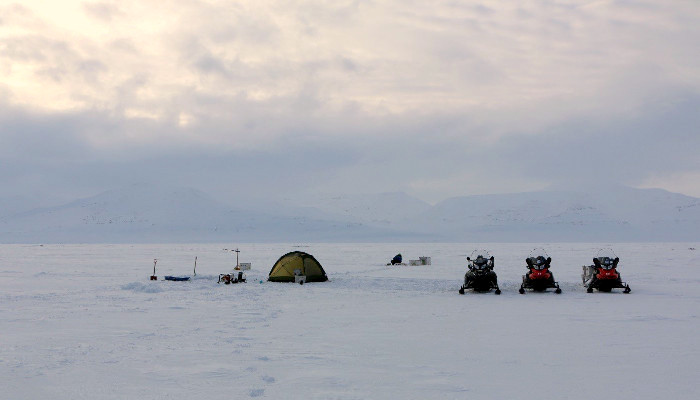
In early April 2015, a small team of 2 Belgian and 2 French researchers went to Svalbard. The goal? Testing new methods to measure sea-ice thickness and ice algal biomass, but also measuring greenhouse gases in the sea ice in relation with the ‘STeP’ (Storfjorden Polynya multidisciplinary study) campaign. With funding from the French Polar Institute (IPEV) and IPSL and logistical arrangements by t ...[Read More]
Cruising for mud: Sediments from the ocean floor as a climate indicator
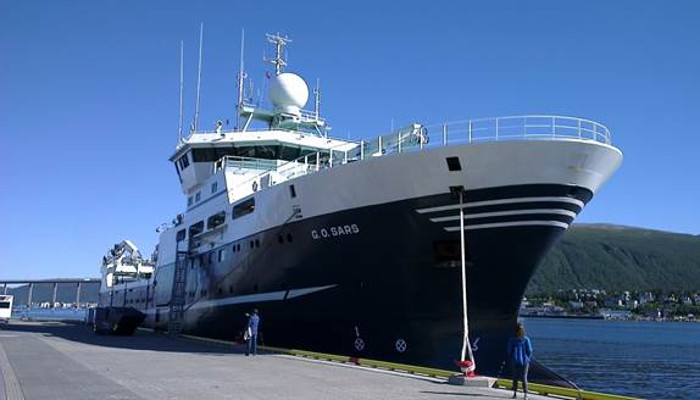
Going on a cruise for a month sounds tempting for most people and that is exactly how I spent one month of my summer. Instead of sunshine and 25 degrees, the temperature was closer to the freezing point on the thermometer and normal summer weather was replaced by milder weather conditions. The destination of the cruise was the western Nordic Sea and the east Greenland Margin. The ice2ice cruise wa ...[Read More]
Do Beers Go Stale in the Arctic? – Jakob Sievers
A story about CO2 -fluxes between sea-ice and the atmosphere What’s it all about? Whenever I have had to describe my PhD research project to people outside of my research community, I have always found it useful to use an analogy most people are familiar with, namely beers. Now that I have the full attention of the entire class, allow me to explain. Say you were to find yourself at an outside café ...[Read More]

