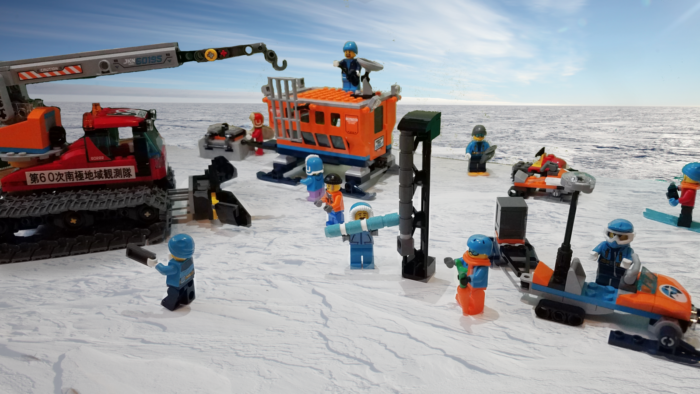
With the current situation, polar fieldwork might be/have been cancelled and we have a suggestion to remedy your field-blues… Why not use ©LEGO to pretend you’re back in the field with the added bonus that you get to be in the warmth and comfort of your home! Here, we’ve re-enacted radar fieldwork that took place a year and a half ago in Antarctica…
But first, let’s start with some background on radar
You can think of a radar system working a bit like an echogram. A radar system sends signals in the form of electromagnetic waves (e.g. light is an electromagnetic wave at frequencies that we can see) to image the properties of the material these waves are sent through. It uses a signal transmitter to create a signal with a specific frequency that is then emitted by the radar antennas into the snow or ice (you can see the type of antennas used on in Illustration 1 where they’re being installed). As the signal travels downwards, it encounters snow or ice with different properties (for example, density increases with depth as snow compacts into ice, the orientation of the ice crystals varies due to pressure or ice flow, or the concentration of aerosols varies with time…). A change in any of these properties means that a part of the signal is reflected back up towards the surface as it encounters this “reflector”. Simultaneously, the rest of the signal continues to travel downwards, until it finds the next reflector. This is repeated time and time again until the signal is eventually too weak and disappears. The signals sent back to the surface are captured and continuously measured by what we call the “receiver”, a device attached to the antennas. The final result of radar measurements is the strength of the signal with depth as it travels deeper and deeper into the snow or ice. Similar to an echogram where a baby is visible in the womb, any significant reflector becomes visible. Now if you repeat this measurement many times along a line, you get a 2D image which gives you a beautiful rendition of the snow and ice’s internal structure and the shape of the bedrock beneath it (see Illustration 2 and this blog post to see an example of a “radargram” or radar image).
In summary: radar uses electromagnetic wave propagation to measure the properties of snow, ice, the thickness of the snow or ice and the bedrock topography beneath them. All this information is essential to better understand, in our case, the Antarctic continent! Now enough theory, let’s follow us back in time to the field in 2018/2019…
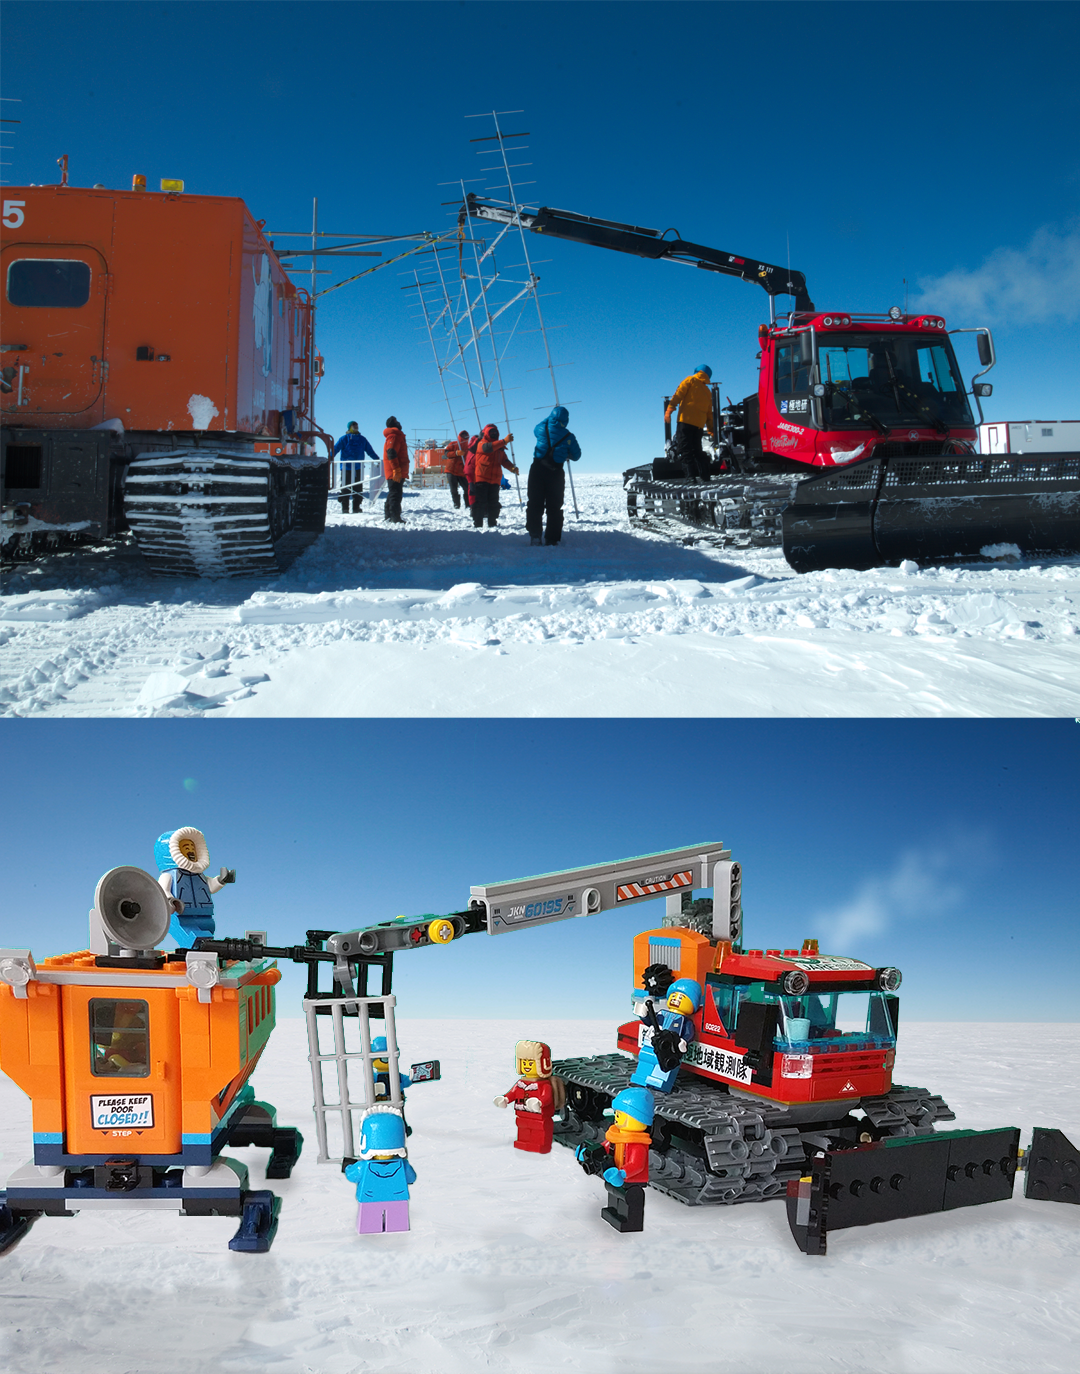
Illustration 1: Action shot of the fieldwork in Antarctica in 2018/2019. Here, you can see the mounting of the (very large) radar antennas on the polar vehicle by the team (spot Brice as one of the guys in red). In this particular area of the East Antarctic plateau (Dome Fuji), the annual mean temperature is about -54 degrees and about -30 degrees during the polar summer, so imagine the technicality of it. Photo credit:(top) Jean-Charles Gallet; (bottom) Brice Van Liefferinge.
How do you collect radar data in remote places such as the Antarctic continent?
Depending on the objectives of your fieldwork (the size of the area you want to image, etc), you can operate your radar system either from the air or from the ground. In this case, Brice was part of a team effort (team members were from the Norwegian Polar Institute (NPI) and the National Institute of Polar Research (NIPR)) to collect radar data over the East Antarctic plateau. The radar system used was operated from the ground, we then call it “ground-penetrating radar”. The East Antarctic plateau reaches altitudes higher than 4000 m above sea level. At this altitude, the air pressure is already low. Combined with the extremely cold temperatures and the polar vortex, the air pressure becomes even lower. Because of this very low pressure, we cannot rely on planes to carry the material out to the measurement site, let alone fly the radar system from the air. A good thing since we didn’t have any aircraft ©LEGO anyway… 🙂
The journey to a remote place
Generally, your journey starts on the Antarctic coast, in a cosy station such as Syowa station for 2018/19 (a Japanese station), where you can collect your vehicles and gear at the station upon your arrival. The logistics of remote fieldwork, especially in Antarctica, are tremendous and nothing can be left to chance. Even a simple missing screw can be problematic! So you only you take off for your remote fieldwork site once you’ve checked you have everything you need. For the fieldwork Brice was involved in, all travel was by “snow” and therefore the whole traverse was spent sitting/sleeping/eating in the orange polar vehicles you can see in Illustration 2. They’re basically containers set on caterpillars. You have to drive quite slowly (5-8 km/h on average) due to the rough snow surface and the caterpillars. Although they look quite big on the outside, they’re not very spacious inside as they have to contain all your equipment/food/furniture to last you for your whole fieldwork. The traverse took roughly four weeks to reach the fieldwork site. Imagine how surreal it can be to be crammed in these containers, driving for days (more if storms strike, such as on the return traverse), always surrounded by surreal white and flat land all around you.
These traverse weeks are always a great opportunity to revise your knowledge on radar… Here, you can see what the 2018/19 traverse looked like. The footage was taken from a drone operated by one of my team members (he has plenty more videos under the name of “Nannkyoku Ozisann” on YouTube, i.e. “Antarctic Uncle”, if you’re curious).
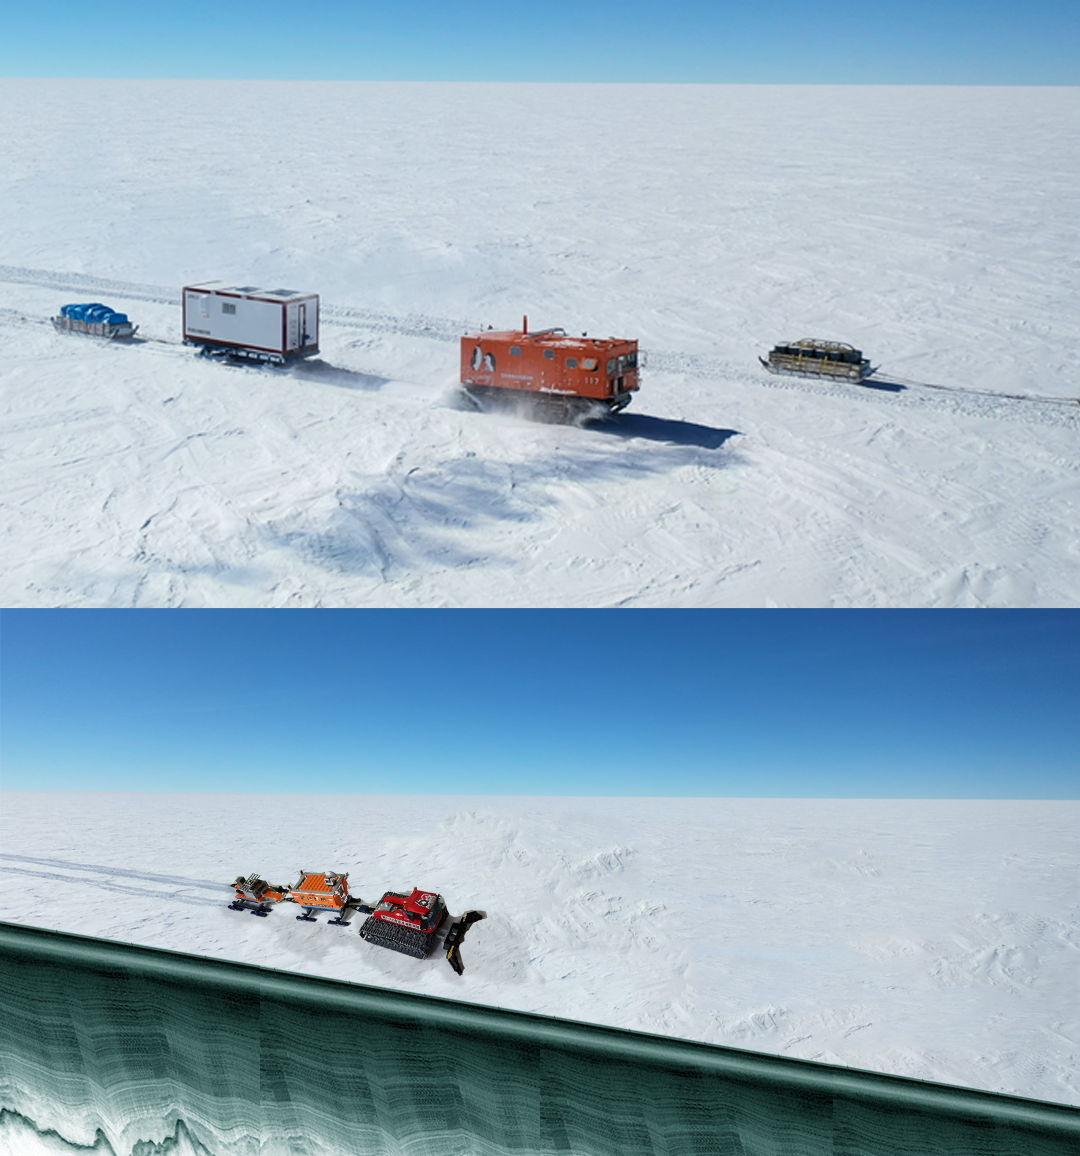
Illustration 2: Aerial shot of the traverse from Syowa station to Dome Fuji, Antarctica, during the 2018/19 field season. Radar data is also collected during the traverse and the result is a radargram (radar image) that’s like an echogram of the snow and ice structure (visible at the bottom). Photo credit: (top) “Nannkyoku Ozisann”; (bottom) Brice Van Liefferinge.
Once you get there
Once you finally reach your fieldwork area, it is time to set up your camp (see cover illustration). Many different types of measurements are often carried out simultaneously to make the most of the long journey to get there. Team members might measure atmospheric gas composition, others drill shallow snow cores or deeper ice cores, some will take photos for surface properties, etc. For Brice and a few others, they were in charge of running the radar system, which started with installing the transmitter, the receiver, the antennas and the GNSS system (a type of GPS system, needed for exact positioning) on the vehicles. Everything was installed onto the polar vehicles (the same ones used to travel in for the traverse, Illustration 1 shows how the antennas are attached). For harsh weather conditions, such as the ones encountered at Dome Fuji on the East Antarctic plateau (-30 degrees on average in the summer), these polar vehicles are ideal to stay warm while you drive! Snowmobiles are also commonly used for radar data collection but generally nearer the coast or stations where the weather is kinder or help is relatively close by. For a snowmobile, you would then pull a set of sledges behind you on which you install your radar equipment (box for emitter, antennas, GNSS, etc), visible in the cover illustration (right corner).
During a typical day, you can spend between 10-12 hours collecting radar data (which means driving your vehicle in the straightest possible line over the snow and ice). To have the best results, the speed of the vehicle cannot be higher than 10 km/h, which means that you can cover a maximum of 120 km per day when everything works well! After you get back to your field camp, no relaxing just yet. You must save all the raw data to external disks/servers and start looking at the data (“process it”) to check that all the instruments are working well. This can take hours, but then you get to enjoy your comforting warm meal admiring your radar images.
After a couple of weeks (three weeks for this 2018/19 season), it’s already time to pack up and go, back to the coast, to the station.
So there we are… Yes Antarctic fieldwork involves a lot of patience. But the immense satisfaction of coming back with those new data (radar or other) to further understand our (polar) world makes it all worth it! Now ©LEt’sGO… !
Further reading:
- “Nannkyoku Ozisann” (or “Antarctic Uncle”) YouTube Channel
- Cryoblog post on radar data
- Cryoblog post on Antarctic fieldwork:
Edited by Violaine Coulon
 Brice Van Liefferinge is a trained geographer, glaciologist and modeller. With a background in geography at the Université libre de Bruxelles (ULB, Belgium), he pursued his interest in Earth sciences during his PhD looking at the thermal regime of the Antarctic Ice Sheet and working on the Beyond Epica Oldest Ice project. He then worked on the Oldest Ice Dome Fuji project with Dr. Kenny Matsuoka at the Norwegian Polar Institute (NPI, Tromsø, Norway) for which he did 3 months of fieldwork at Dome Fuji, Antarctica. He tweets as @bvlieffe.
 Marie Cavitte is a PostDoc at the Georges Lemaître Centre for Earth and Climate Research, at UCLouvain in Belgium. She studies surface mass balance in Antarctica as part of the Mass2Ant project. She investigates why reconstructed surface mass balance history varies between observations and models. Marie is one of the chief-editors of this Cryoblog. She tweets as @MarieCavitte.

