Invited guest from the EGU 2024 Outstanding Student and PhD candidate Presentation (OSPP) Award
Context
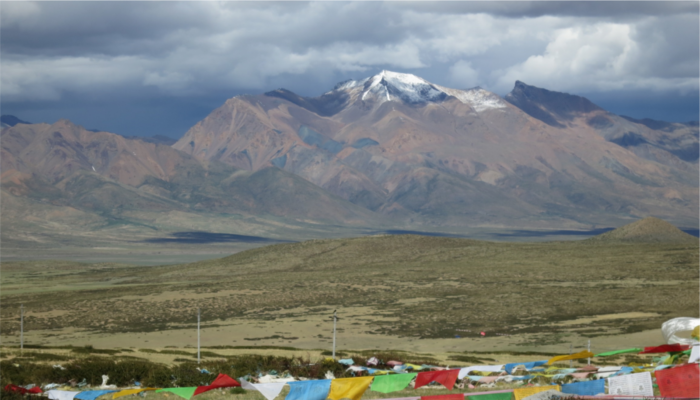
The Sichuan Basin, located at the eastern slope of the Tibetan Plateau in China, is a lowland region that regularly experiences heavy rainfall during the summer months. This is due to its complex topographical features (Fig. 1) and the influence of the East Asian monsoon. The heavy rainfall can lead to flooding and landslides, posing significant threats to the lives and livelihoods of the over 100 million people living in the area [1]. The summer of 2020 was particularly notable for its extreme precipitation, with some stations recording over 400 mm of rainfall in one day [2]. Understanding the causes and physical processes behind such events is highly relevant, especially since their frequency and intensity are expected to increase in a warmer climate.
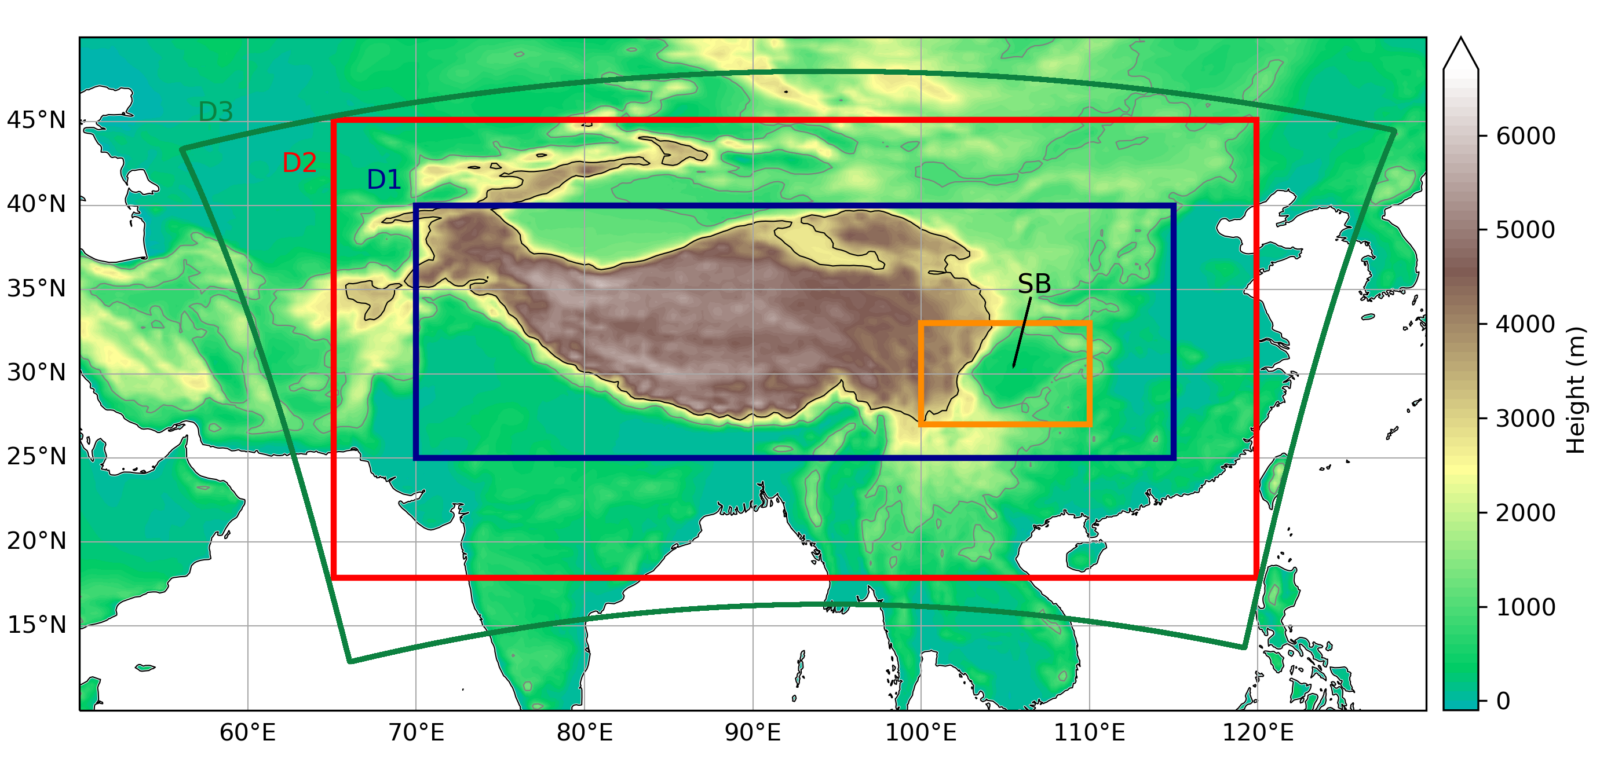
Figure 1: Topography (ERA5) and model domains (D1-D3). The orange box indicates the study area (27-33 °N, 100-110 °E) with the Sichuan Basin (SB).
Why do we need high-resolution climate models?
In remote regions with complex terrain like the Tibetan Plateau (an elevated region surrounded by prominent mountain ranges and two of the highest summits in the world), precipitation observations from rain gauges are sparse, while indirect measurements from satellites, for example, often lack accuracy [5]. This is where regional climate models come in. Modelling the climate in mountainous regions is a challenging task for various reasons [4]: First, the complex topographical features influence local weather and climate patterns and are difficult to implement in climate models. Second, factors such as orography, ice, and snow add layers of complexity and require sophisticated models. And third, models with coarser resolution often fail to capture these processes, causing models to produce too much rain [5]. However, recent developments in regional climate modelling at scales below 4 km show promising improvements as they can represent orography and convective processes better than coarser models [6]. While the latter parameterize deep convection (i.e. the vertical transport of warm, moist air masses), the so-called convection-permitting models explicitly resolve convective processes. In this way, they provide more accurate simulations of precipitation, such as the timing of precipitation during a summer day and the intensity of extreme precipitation [7], making them a powerful tool to help us improve our understanding of extreme weather events.
About the study
A realistic representation of extreme events in climate models can serve as a foundation for more reliable future projections and uncertainty estimates. In our study, we establish the following two research questions: (1) How well do different high-resolution simulations capture selected extreme precipitation events, and (2) How do they differ among each other in representing the events and important related physical factors? To address our scientific concerns, we analyse simulations which were done with three regional climate models, namely ICON (Fig.1, D1), at the Goethe University Frankfurt, WRF (Fig. 1, D2) at the University of Gothenburg and the National Center for Atmospheric Research, respectively, and COSMO-CLM (Fig. 1, D3) at the University of Innsbruck. We evaluate their performance in representing the heavy and extreme precipitation events that occurred in the Sichuan Basin during the summer of 2020. The simulations are part of the CORDEX Flagship Pilot Study Convection Permitting Third Pole, a project that aims to improve our understanding of the water cycle over the Tibetan Plateau and its surrounding regions using a multi-model ensemble of kilometer-scale simulations (Project website: http://rcg.gvc.gu.se/cordex_fps_cptp/).
Observed vs. simulated precipitation of the August 2020 extreme event
As one part of our analysis, we calculated the daily accumulated precipitation (which means the total amount of precipitation that falls over a 24-hour period) for the extreme event that happened during August 11-17 in 2020. The highest values occurred on August 11 with over 200 mm of precipitation on that day according to observational data from satellites (“GPM IMERG”, Fig. 2). A comparison of these observations with the model simulations (Fig. 2) reveals that all models fail to reproduce the exact location and intensity of the observed rainfall that occurred along the edge of the Tibetan Plateau. While the WRF simulations underestimate the amount of precipitation almost throughout the whole period, both COSMO-CLM and ICON produce higher rainfall but in different locations, with ICON being the closest to the observed pattern. Our result is consistent with previous studies assessing model performance in the Tibetan Plateau region.
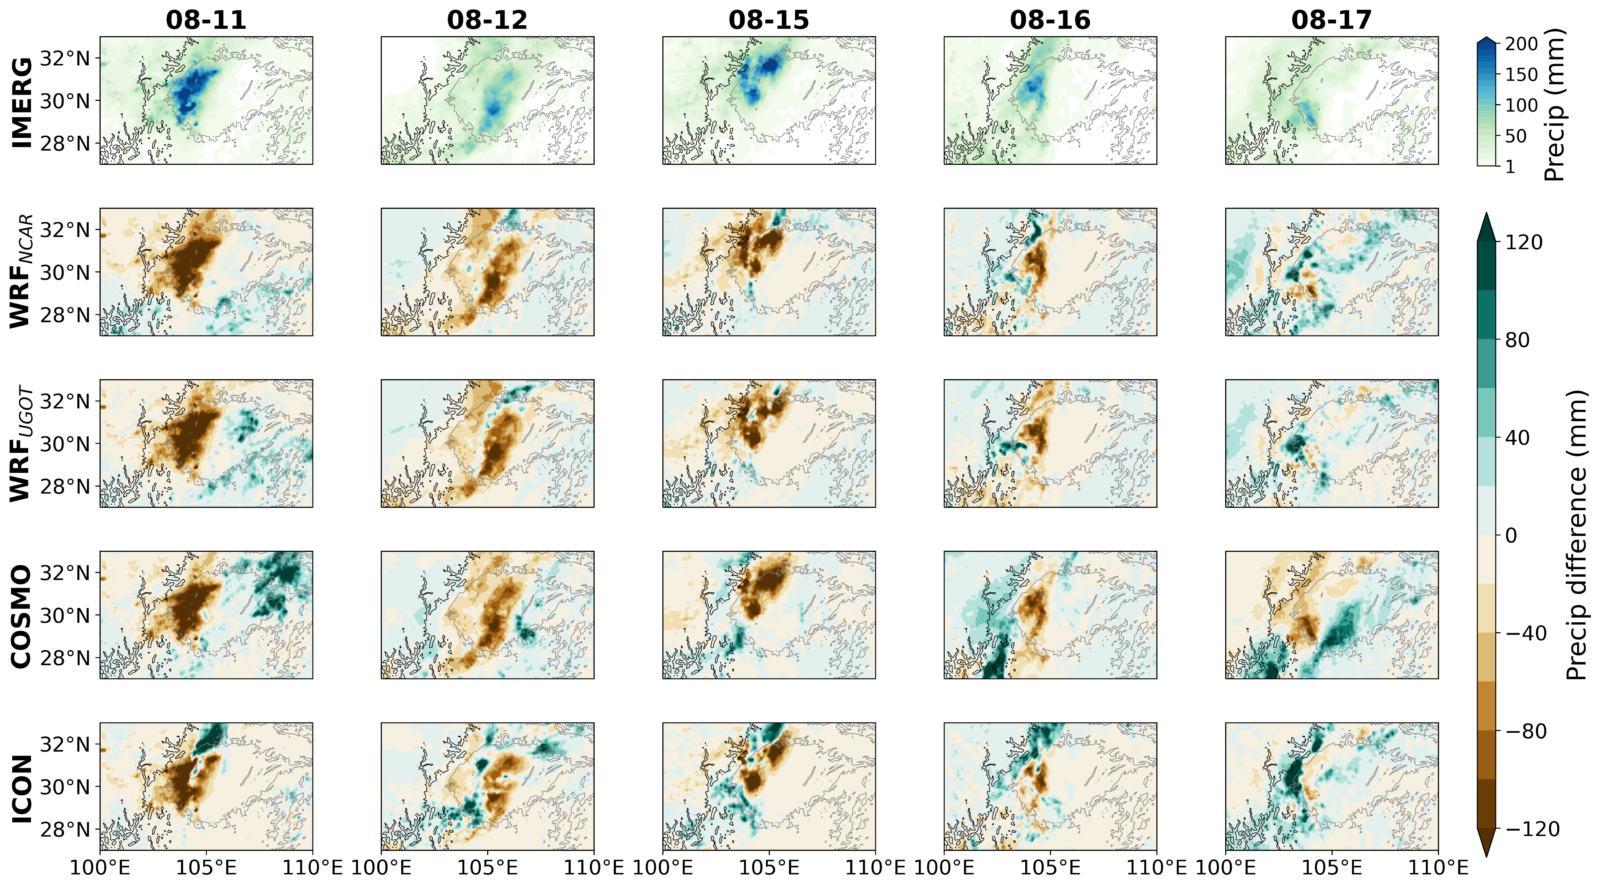
Figure 2: Daily accumulated precipitation of GPM IMERG (first row) and difference in daily accumulated precipitation of CPTP simulations and GPM IMERG (rows 2-5) during August 11-12 and 15-17, 2020. For positive values, the simulated precipitation is higher than the observed. The black and grey lines mark the 3000 m and 700 m contours used as Tibetan Plateau and Sichuan Basin outline, respectively.
Key findings:
- Precipitation patterns: All models underestimate the precipitation or miss the location of the events. Overall, ICON performed best compared to COSMO and WRF.
- Atmospheric circulation: An accurate representation of the westerly jet stream (a fast-flowing, narrow air current in the upper atmosphere) was crucial for accurate simulation of the different events. Again, ICON was best at representing these features.
- Atmospheric moisture transport: Water vapor transport into the Sichuan Basin might have been a significant factor. ICON’s simulation was most similar to the ERA5 reanalysis used for comparison, yielding a possible explanation for its high performance in precipitation analysis.
Take-Home message
Convection-permitting climate models can help us understand key mechanisms behind extreme precipitation events which will gain in importance due to climate change. However, model performance in capturing the intensity and location of the events, as well as related physical factors, requires further improvement.
This post has been edited by the editorial board.
This work is part of Laura Detjen Master’s thesis at the University of Gothenburg.
Click here to download the poster/PICO file.
References:

[1] Qian, T., Zhao, P., Zhang, F., & Bao, X., 2015. Rainy-Season Precipitation over the Sichuan Basin and Adjacent Regions in Southwestern China. Monthly Weather Review, 143(1), 383–394. doi: 10.1175/MWR-D-13-00158.1

[2] Qian, C., Ye, Y., Zhang, W., & Zhou, T., 2022. Heavy Rainfall Event in Mid-August 2020 in Southwestern China: Contribution of Anthropogenic Forcings and Atmospheric Circulation. Bulletin of the American Meteorological Society, 103(3), 111–117. doi: 10.1175/BAMS-D-21-0233.1

[3] Liu, Z., Gao, Y., & Zhang, G., 2022. How well can a convection-permitting-modelling improve the simulation of summer precipitation diurnal cycle over the Tibetan Plateau? Climate Dynamics, 58(11-12), 3121–3138. doi: 10.1007/s00382-021-06090-3

[4] Zhou, X., Yang, K., Ouyang, L., Wang, Y., Jiang, Y., Li, X., Chen, D., & Prein, A., 2021. Added value of kilometer-scale modeling over the third pole region: a CORDEX-CPTP pilot study. Climate Dynamics, 57(7-8), 1673–1687. doi: 10.1007/s00382-021-05653-8

[5] Li, P., Furtado, K., Zhou, T., Chen, H., & Li, J., 2021. Convection-permitting modelling improves simulated precipitation over the central and eastern Tibetan Plateau. Quarterly Journal of the Royal Meteorological Society, 147(734), 341–362. doi: 10.1002/qj.3921

[6] Collier, E., Ban, N., Ahrens, B., Chen, D., Chen, X., Lai, H.-W., Leung, R., Li, L., Ou, T., Pothapakula, P. K., Potter, E., Prein, A. F., Richter, N., Sakaguchi, K., Schroeder, M., Singh, P., Sobolowski, S., Sugimoto, S., Tang, J., & Ziska, C., 2024. The first ensemble of kilometer-scale simulations of a hydrological year over the third pole. Climate Dynamics, 62, 7501–7518. doi: 10.1007/s00382-024-07291-2

[7] Prein, A. F., Gobiet, A., Suklitsch, M., Truhetz, H., Awan, N. K., Keuler, K., & Georgievski, G., 2013. Added value of convection permitting seasonal simulations. Climate Dynamics, 41(9-10), 2655–2677. doi: 10.1007/s00382-013-1744-6