

Drawing inspiration from new research shared by EGU scientists, this column brings you some of the latest publications. This edition covers the globe, from the air we breathe in Ireland and China to the waves that stitch the tropics to the Southern Hemisphere.
Surface ozone in Ireland: where does it really come from?
Ozone plays both hero and villain in our atmosphere. High up in the stratosphere it shields us from harmful UV radiation. At ground level it is a pollutant: a greenhouse gas, and a powerful oxidising agent that harms human health, vegetation and crop yields. Near the surface, ozone isn’t emitted directly. It forms photochemically from precursor pollutants, namely nitrogen oxides (NOx) and volatile organic compounds (VOCs). Its chemistry is also non-linear, so the presence of NOx can either speed up ozone production or destroy ozone, depending on meteorology and local chemical conditions.
Despite pollution controls in Europe and North America, ozone in western Europe hasn’t fallen in proportion, particularly at background stations on the North Atlantic coast. Studies of Northern Hemisphere background ozone trends have also disagreed. In a new preprint, a team led by researchers at the University of Galway, including Nikhil Korhale and Liz Coleman, combines two decades of measurements with advanced modelling to quantify, for the first time in Ireland, how different sources contribute.
Ireland is a revealing test case. Much of its surface ozone is imported through long-range transport and exchange between the stratosphere and troposphere, so Irish ozone is shaped by air arriving from the North Atlantic and Europe, whatever happens to Irish emissions. Among the key findings:
- Ozone has been increasing at Irish urban sites over the last two decades, particularly in winter.
- High-ozone events occur more often in spring and at remote coastal sites.
- The spring peak and summer dip reflect a mix of stratospheric intrusions, lightning NOx, long-range and hemispheric transport, and regional emissions.
- Model-based trend analysis points to East Asian and aviation emissions as significant contributors to the rising winter trend, while reduced North American and European emissions explain falling spring ozone.
- At the Mace Head coastal station, sorting air masses by their trajectories showed that 35% of ozone exceedances occurred in clean air masses, with the rest in air influenced by Europe.
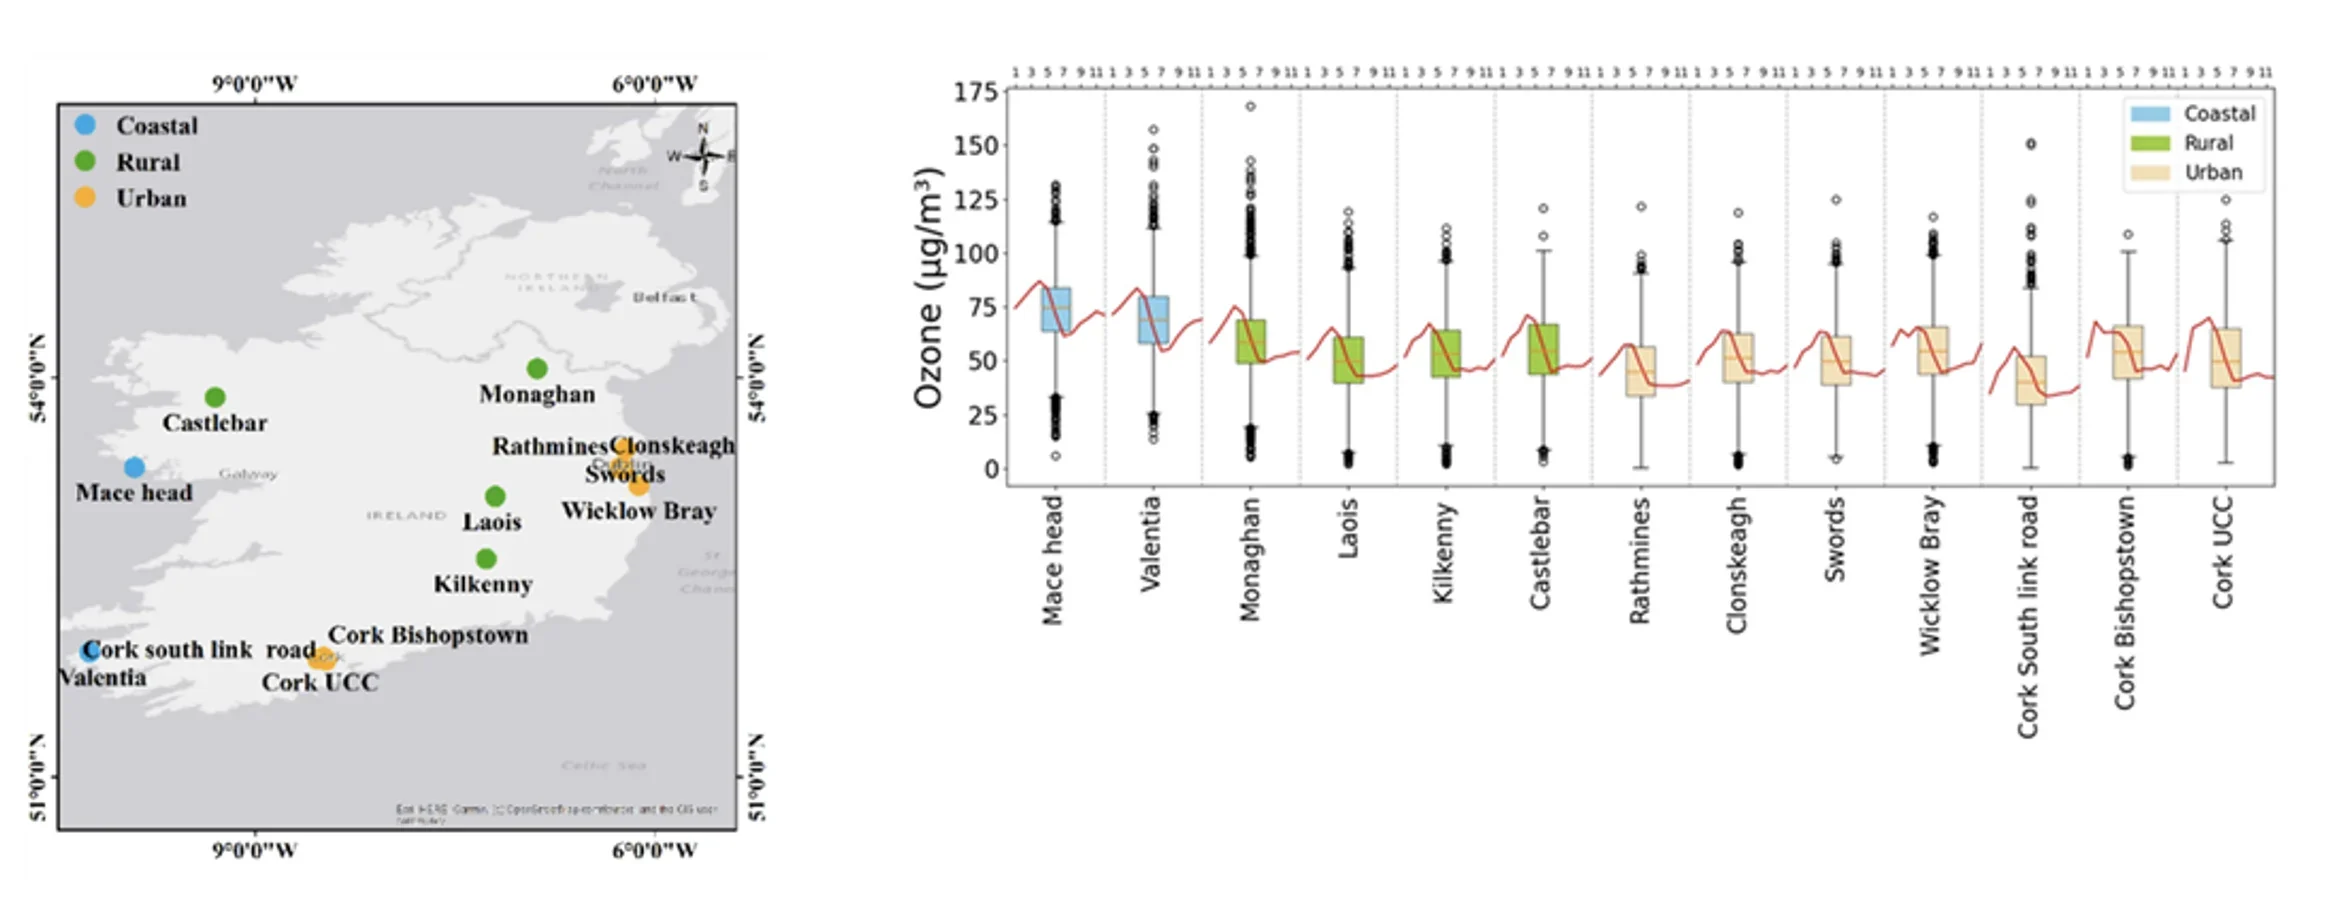
a) EPA ozone measurement sites over Ireland with classification of backgrounds. (b) Annual average ozone concentration and average monthly ozone (redline).
Mercury isotopes reveal a changing atmosphere over Tianjin
Mercury has a long memory. Once emitted, it can travel long distances, deposit on land or water, enter food webs and be re-released into the air. So, as the authors of a new study from Tianjin University note, falling emissions don’t automatically mean a cleaner atmosphere, and measuring concentrations alone isn’t enough to show that controls are working.
Ruoyu Sun and colleagues tracked atmospheric mercury in Tianjin, a megacity in northern China, across three periods: 2018, before major recent emission cuts; 2021–2022, during the COVID-19 lockdown; and 2024–2025, after activity resumed under tighter controls. They paired concentration measurements with mercury isotope analysis, which works as a fingerprint of pollution sources and atmospheric processing.
Gaseous elemental mercury dropped from about 4.6 ng m−3 in 2018 to around 1.5 ng m−3 during lockdown, and crucially it stayed low afterwards. The isotopes explain why. In 2018 the signature matched strong primary emissions such as coal combustion and industry. By 2021–2022 it had moved close to regional background air, and it stayed there. An isotope-based mixing model attributes the drop mainly to a collapse in anthropogenic contributions, rather than to large changes in the background pool or in surface re-emission.
Two further results stand out:
- An urban and a suburban site in Tianjin were far more similar than expected for a heavily polluted city, with both dominated by background mercury.
- Day–night concentrations barely differed, yet the isotopes hinted at a small, sunlight-driven daytime input from urban surfaces and other legacy reservoirs.
That second point raises a new challenge: as new emissions shrink, old mercury stored in soils, buildings and other surfaces may become easier to detect, and more important. Comparisons with other Chinese cities, which clustered near present-day Northern Hemisphere background levels, and with Karachi, Pakistan, where concentrations were much higher and primary emissions dominate, show what successful controls look like in the atmosphere. The authors suggest this is a useful yardstick for evaluating the Minamata Convention on Mercury.
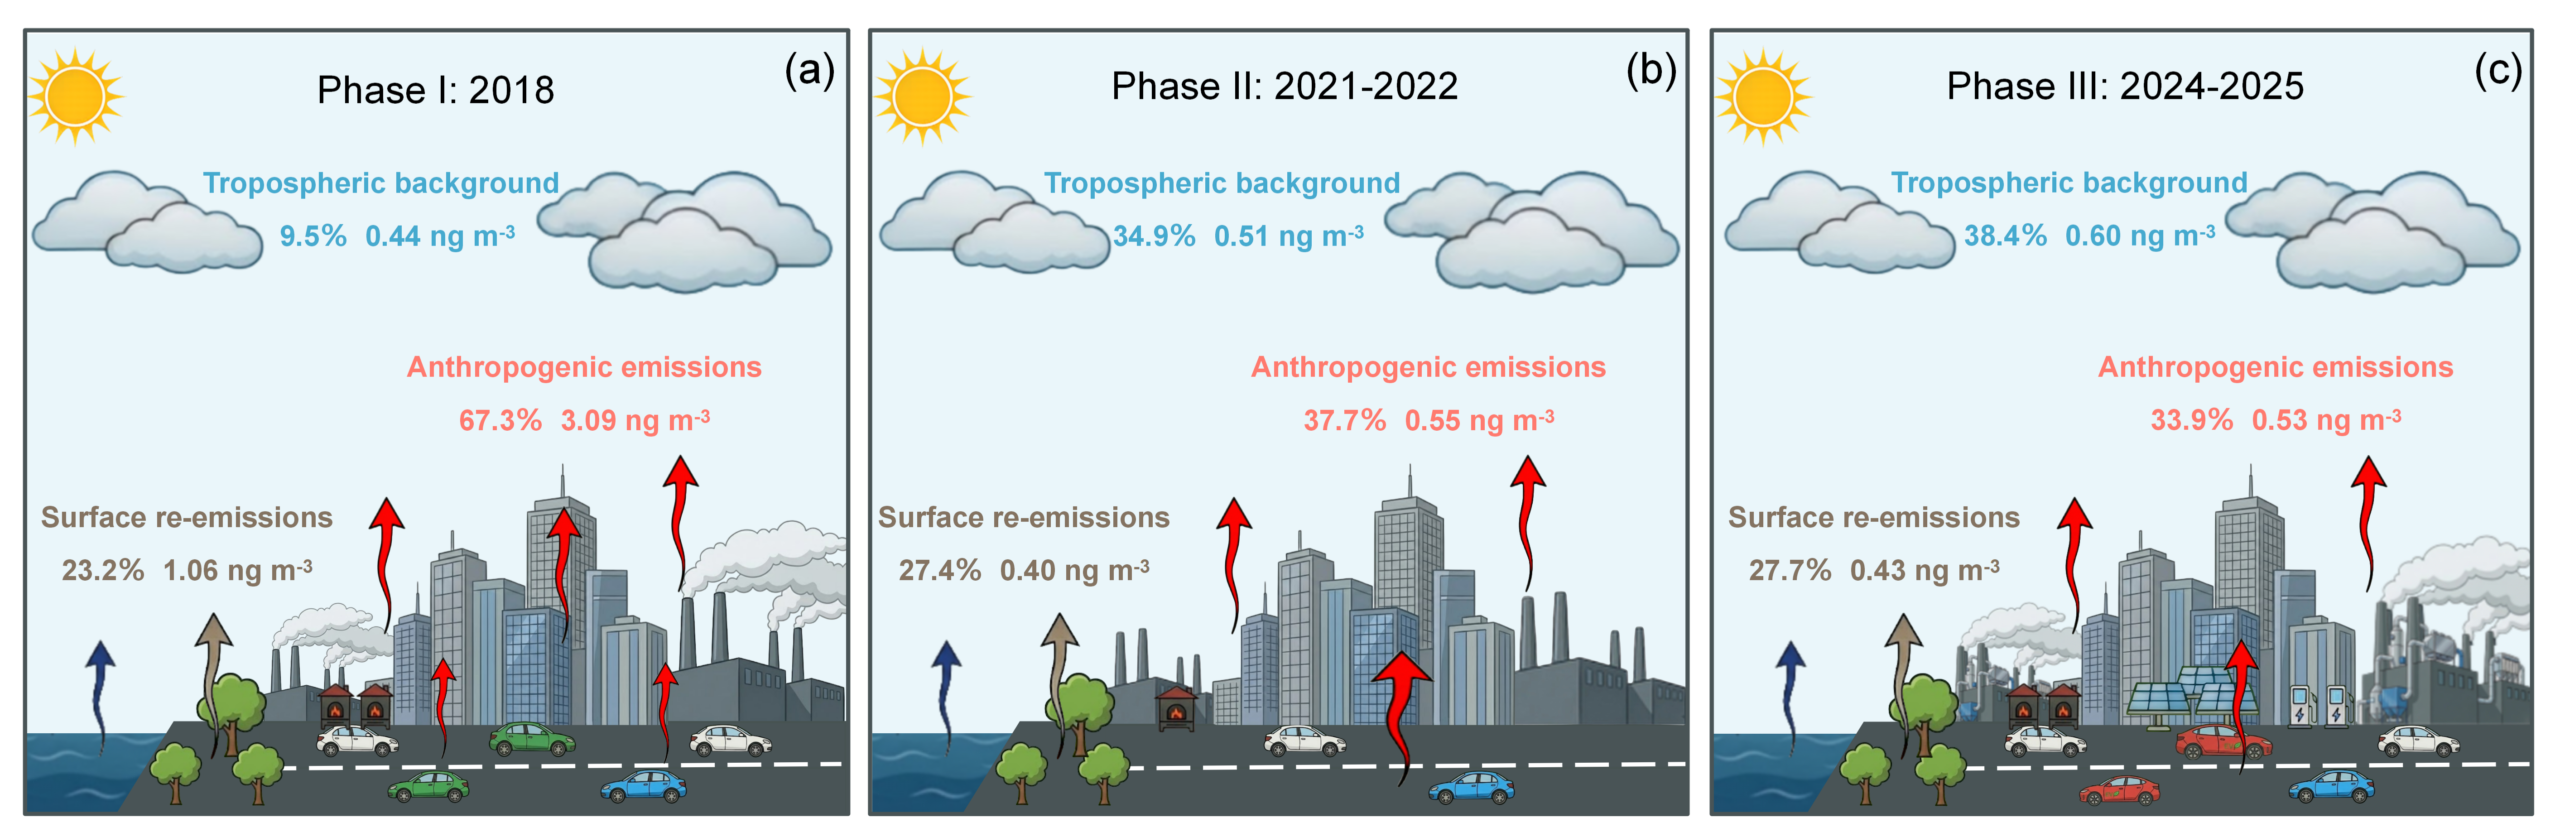
Source contributions to GEM concentrations across three study phases in urban Tianjin. (a) Phase I (2018), (b) Phase II (2021- 2022), and (c) Phase III (2024-2025) show the estimated relative and absolute contributions of primary anthropogenic emissions, surface re-emissions, and the tropospheric background GEM to near-surface GEM concentrations.
A “symphony” of equatorial waves over the western North Pacific
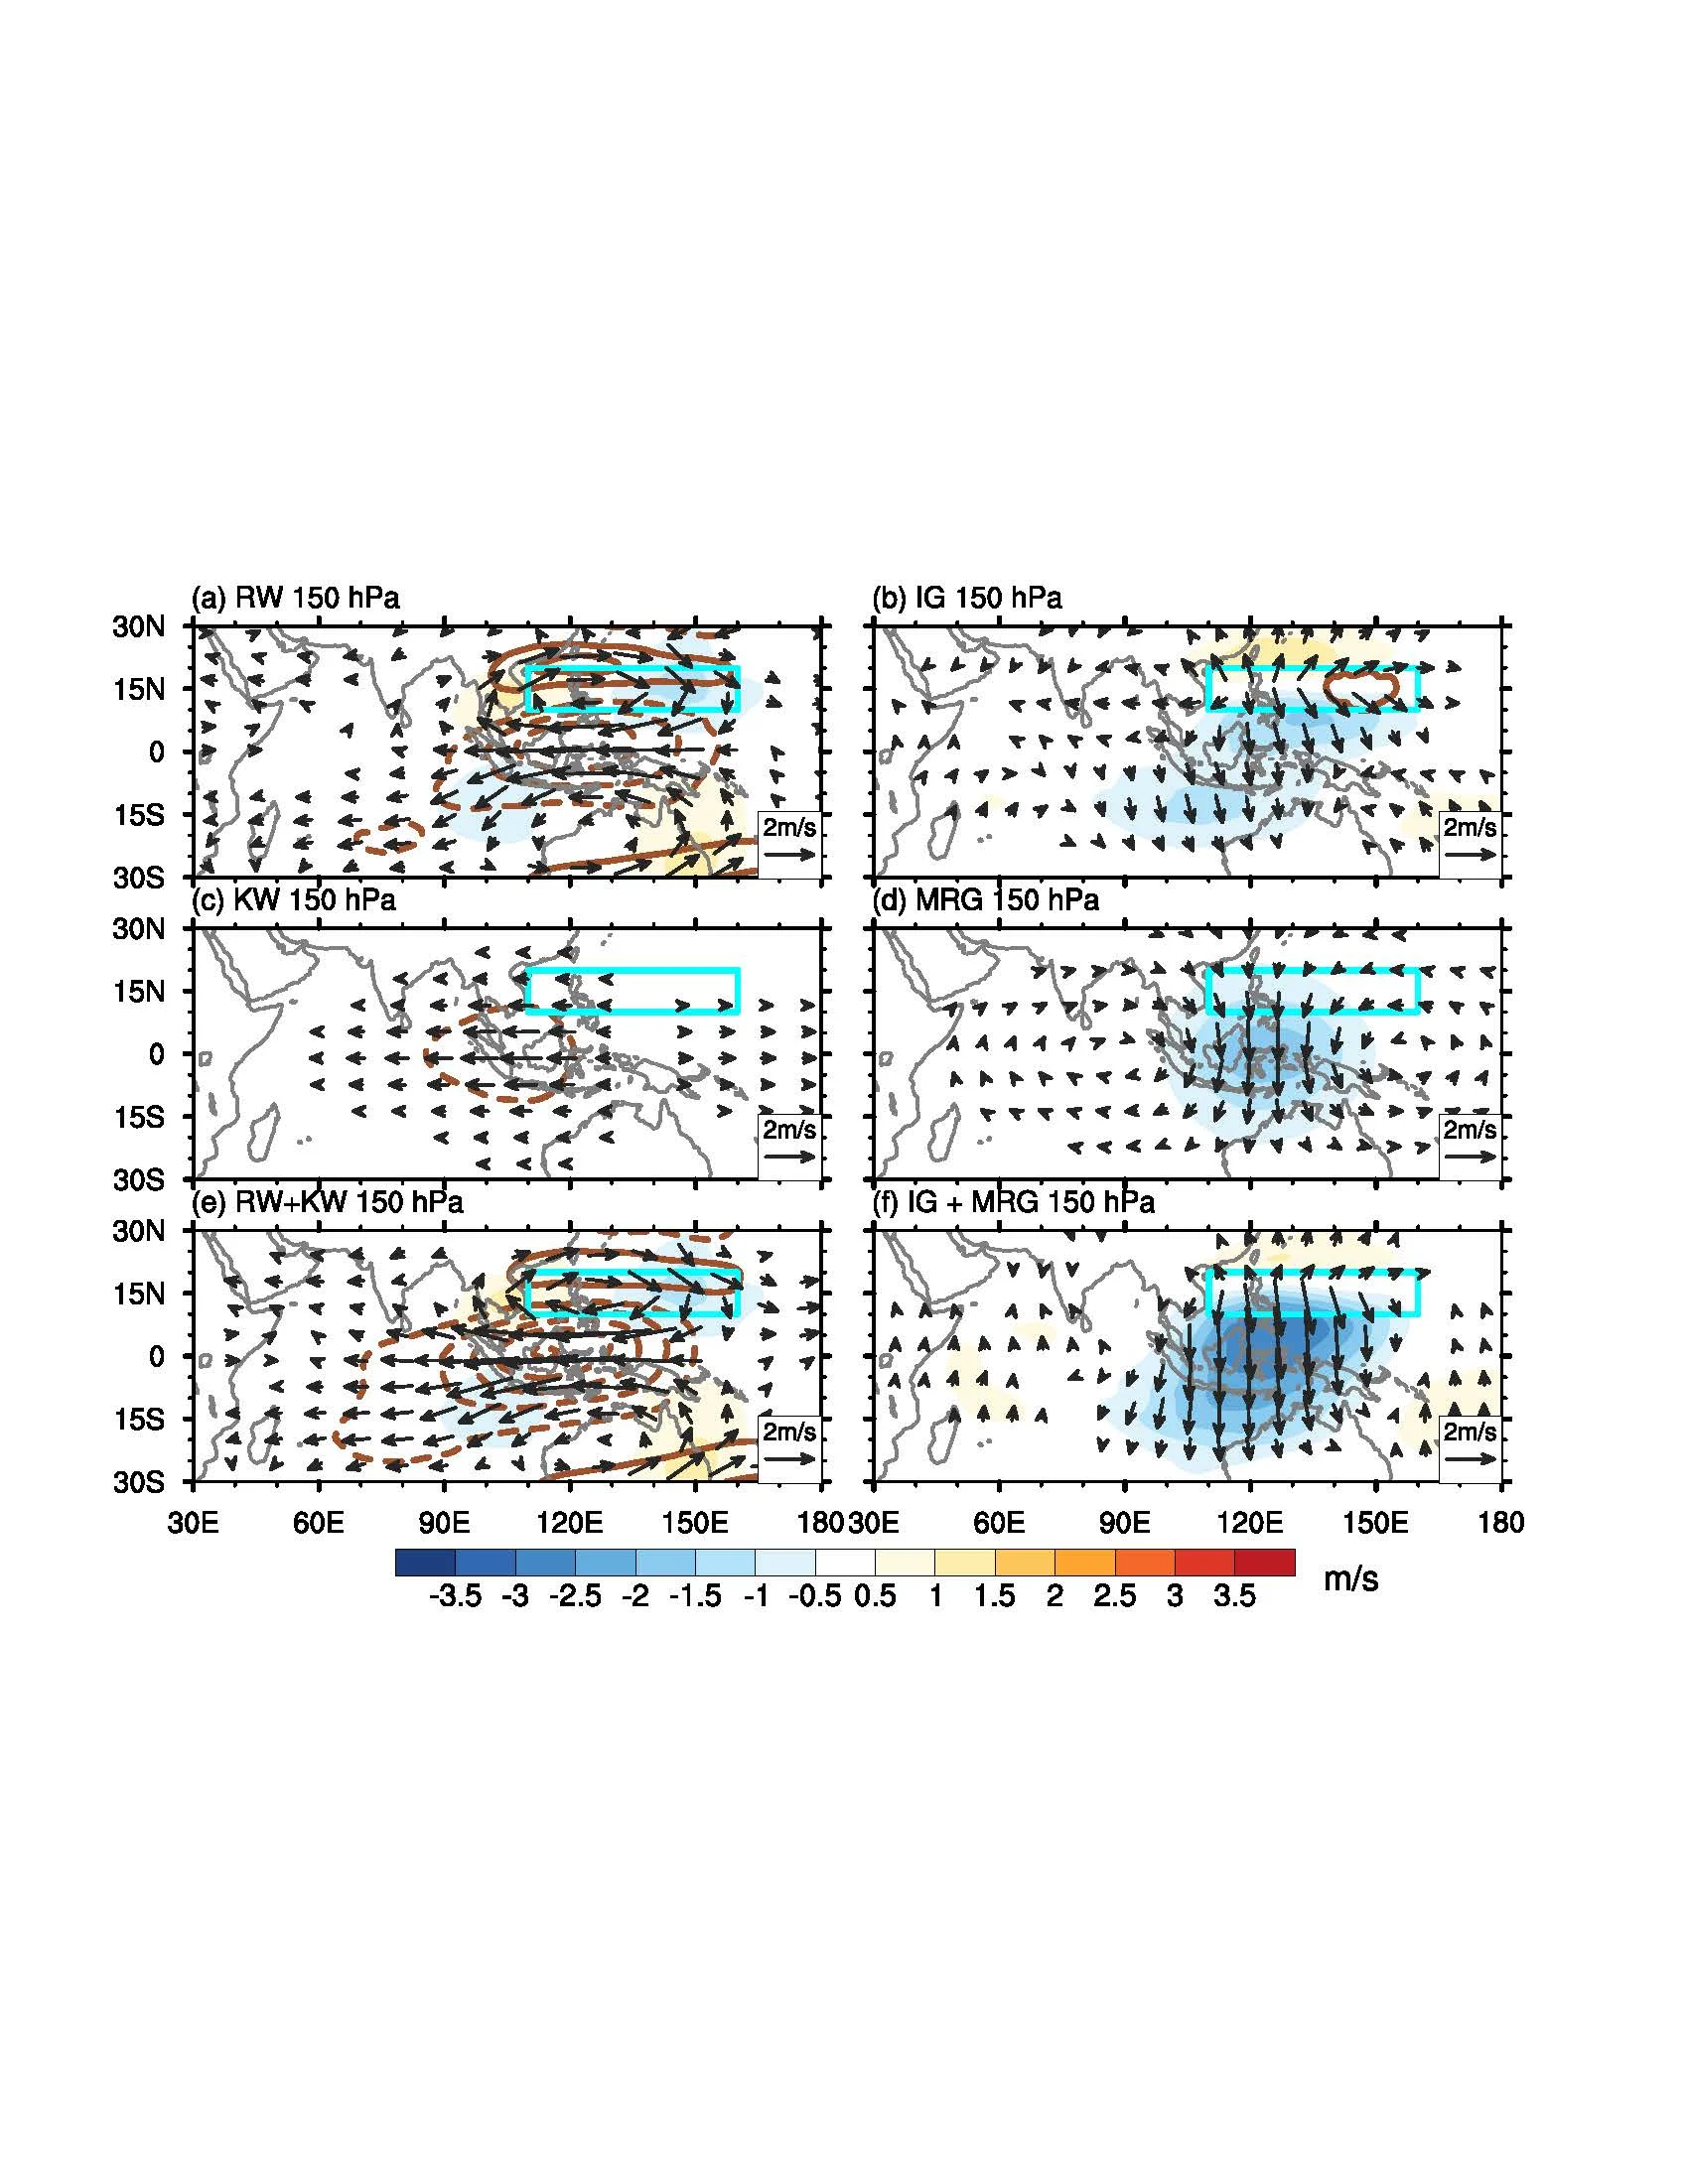
(a) Rossby waves, (c) Kelvin waves, (e) the sum of Rossby waves and Kelvin waves, (b) IG waves, (d) MRG waves and (f) the sum of IG and MRG waves associated with the OLR variability over the SWNP region at 150 hPa. Shading denotes the meridional wind whereas full and dashed contours represent the westerly and easterly zonal winds, respectively. The contouring interval for the zonal wind is 1 ms-1, and the zero contour is omitted. Vectors indicate the horizontal wind anomalies with magnitudes greater than 0.2 ms-1.
In boreal summer, intense convection over the warm subtropical western North Pacific (SWNP) acts like a pump of heat away from the equator, influencing circulation across Asia and even the Southern Hemisphere. For decades, researchers have interpreted this response using Gill’s classic 1980 solution, in which Rossby waves produce a cyclone to the west of the heating and Kelvin waves bring easterlies to the east.
A new preprint by Peishan Chen of the Institute of Atmospheric Physics, Chinese Academy of Sciences, argues that this picture captures only part of the story. Using a wave decomposition based on the normal modes of the three-dimensional spherical atmosphere (the MODES software) applied to ERA5 reanalysis data, Chen follows the full life cycle of SWNP convection and separates the circulation into its Rossby, Kelvin, inertia-gravity (IG) and mixed Rossby-gravity (MRG) wave components, the different “notes” of the symphony.
The Rossby and Kelvin waves behave as Gill predicted, producing an upper-level anticyclone over the SWNP that is strengthened on its equatorward flank by Kelvin wave easterlies. But IG and MRG waves turn out to have comparable amplitudes, and they are the primary contributors to the upper-level northerly flow across the equator over the Maritime Continent. They are missing from the classical theory because the long-wave approximation behind the Gill solution filters them out.
The waves also help link the tropics to the south. As SWNP convection decays, IG-wave meridional flow reinforces a Rossby-wave anticyclone near Australia, which previous studies suggest can trigger a wave train in the Southern Hemisphere extratropics during austral winter. The study is a cautionary note for anyone applying the Gill solution to off-equatorial heating.
Want to read more?
- Surface ozone levels in Ireland – long-term trends: a modelling and measurement study
- Isotopes over Tianjin: atmospheric mercury and pollution controls
- A symphony of equatorial waves associated with atmospheric convection over the subtropical western North Pacific in boreal summer