EGU Blogs

Four Degrees

Towards a greener energy world?

Marion reports on the latest Grantham Institute for Climate Change special lecture by International Energy Agency Chief Economist Dr Fatih Birol. 

On January 29th, I attended the Grantham Institute for Climate Change special lecture by International Energy Agency (IEA) Chief Economist Dr Fatih Birol at Imperial College London. Dr Birol discussed the future of the world’s energy market and outlined the main conclusions of the IEA World Energy Outlook report published in November last year. Here are the main points of Dr Birol’s lecture.

The long-held tenets of the energy sector are being rewritten

Trade patterns are changing and countries are switching roles, with long-established energy importers becoming exporters.

–        The United States will soon become a significant gas exporter;

–        Brazil is predicted to become a major net oil exporter around 2015;

–        The Gulf States will increasingly export towards Asia.

US shale gas production, historical and projected - Source: US Energy Information Administration, Wikimedia Commons.

US shale gas production, historical and projected – Source: US Energy Information Administration, Wikimedia Commons.

This is mainly due to the shale revolution and changes in nuclear policies of some countries following the Fukushima nuclear disaster. These new supply options are reshaping ideas about the distribution of resources.

However, long-term solutions to the global energy challenges remain scarce. There is a renewed focus on energy efficiency but CO2 emissions continue to rise. One problem remains the heavy subsidies of fossil fuel prices. These give an increased impetus to the consumption of coal, oil and gas and make it difficult for the clean energy industry to compete.

China is currently the main driver of the increased energy demand but India is predicted to take over in 2020 as the principal source of growth.

Most importantly, 1.3 billion people still lack access to electricity, mainly in Africa and South Asia, and the world must solve this problem.

What proportion of fossil fuels?

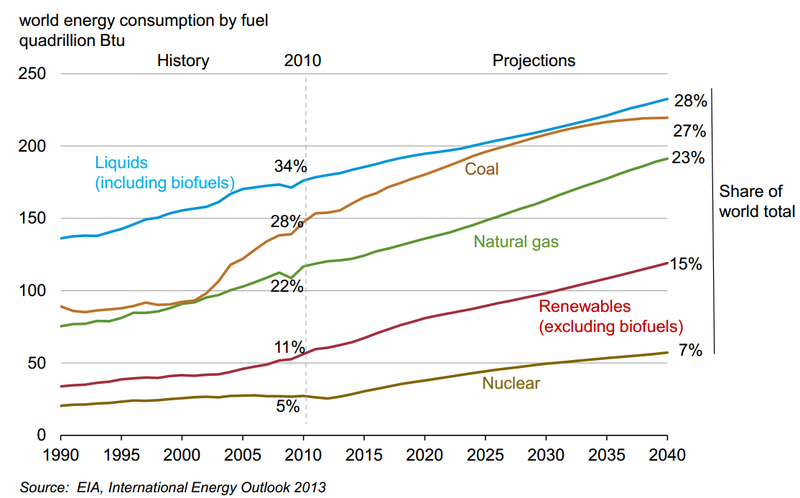
Twenty-five years ago, fossil fuels accounted for 82% of the global energy mix. It still accounts for 82% today, suggesting that reduction policies are not effective. Nonetheless, this number would perhaps be even higher if these policies were not in place.

The proportion of fossil fuels is predicted to decrease to 75% by 2035. They will still dominate in the near future, but the amount of renewables will increase.

With this fossil fuel energy mix, CO2 emissions will continue to increase and temperatures are set to rise by 3.6 degrees, which would have major environmental implications.

No more excuses?

As the most important energy consumer and CO2 emitter, it is very important that China be part of the future energy landscape. The country is currently relying on two premises to justify its share of global emissions:

1. Holding the past to account

OECD member states (as of 2006) - Source: St. Krekeler, Wikimedia Commons.

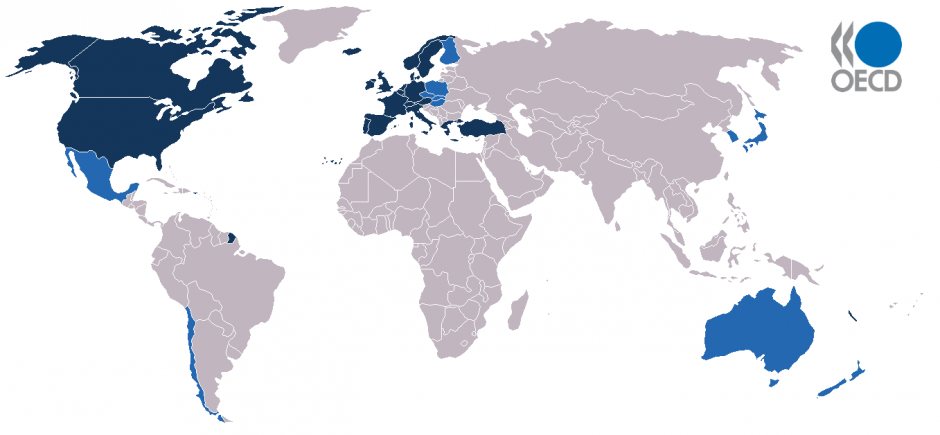
OECD member states (as of 2006) – Source: St. Krekeler, Wikimedia Commons.

The world cannot look only at today’s emissions but must take the past into consideration. The United States and the European Union became rich by using large quantities of coal to push the industrial revolution, so they bear the largest responsibility in today’s CO2 concentrations.

However, the responsibility of non-OECD countries will soon increase and will account for rising shares of emissions. It is thought that the energy consumption of non-OECD countries will be half that of OECD countries in 2035.

2. Emissions per capita over total emissions

With over 1.3 billion inhabitants, China’s total emissions are logically higher. The world must focus on emissions per capita.

However, models predict that Chinese consumption per capita will exceed that of some OECD countries next year.

We should be optimistic about Paris

The 21st session of the Conference of the Parties to the UNFCCC will be held in Paris in 2015. We can be optimistic that world leaders will reach an agreement for three reasons:

Source: J.M. Schomburg, Wikimedia Commons.

Source: J.M. Schomburg, Wikimedia Commons.

–        US emissions are decreasing, with current emissions at the level of those of the early 1990s. This is mainly a result of replacing coal with natural gas.

–        Chinese increase in CO2 emissions has been one of the slowest in the past year. This is a result of decreasing coal consumption and investment into renewables. It is likely we will see limitations for coal consumption both locally and nationally in the near future.

–        The EU is very active and remains committed to reducing emissions.


Can we achieve a 2 degree warmer world?

Under the current energy landscape, the world is not on track to keep average warming to 2 degrees by the end of the century. The IEA has outlined four energy policies that can keep this scenario alive, coined the 4-for-2 degrees scenario . These four policies could stop the growth of emissions by 2020 at no net economic cost and decrease emissions by 31 Gt, 80% of the saving required to be on track for a 2 degrees warmer world.

1. Implement new energy efficiency measures.

Targeted energy efficiency measures in buildings, industry and transport account for nearly half the emissions reduction in 2020. These will pay back within 5 years, with the additional investment required being more than offset by reduced spending on fuel bills.

The coal-fired Kintigh Generating Station in Somerset, New York - Source: Matthew D. Wilson, Wikimedia Commons.

The coal-fired Kintigh Generating Station in Somerset, New York – Source: Matthew D. Wilson, Wikimedia Commons.

2. Limit the use of inefficient coal power plants.

This would achieve more than 20% of the emissions reduction required and reduce local air pollution. The share of power generation from natural gas and renewables would increase in parallel.

3. Avoid methane escape during oil and gas production.

Emissions of methane (a strong greenhouse gas) during the production of oil and gas can easily be fixed with no negative economic impact. This requires a 0.6% investment for a reduction of half of methane emissions. This would provide 18% of the savings by 2020.

4. Partially phase-out of fossil fuel subsidies.

Implementing a partial phase-out of fossil fuel consumption subsidies would account for a 12% reduction in emissions.

There are four reasons to remain optimistic about the likelihood of implementing these policies:

–        Political support: At the 2013 IEA Ministerial meeting in Paris in November, Energy Ministers agreed to push these measures forward.

–        The US have declared they are committed to finding ways to remove support for inefficient coal power plants.

–        The World Economic Forum Annual Meeting in Davos revealed that several oil and gas companies were interested in cutting down their methane emissions.

–        G20 countries are discussing fossil fuel subsidies.

What future for the energy sources?

Oil Rig at Port Khaled, UAE - Source: Basil D Soufi, Wikimedia Commons.

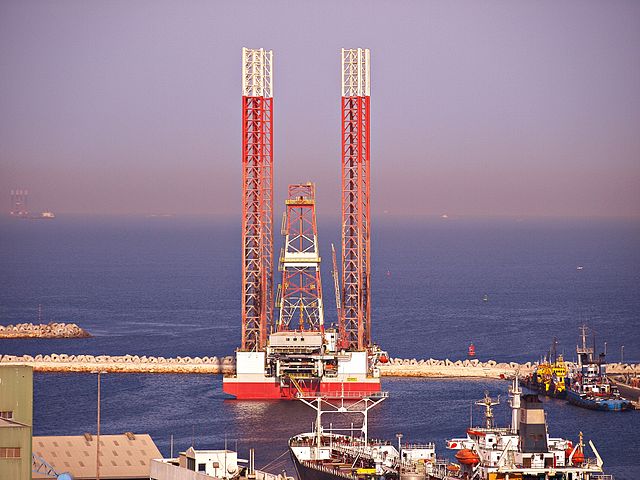
Oil Rig at Port Khaled, UAE – Source: Basil D Soufi, Wikimedia Commons.

Oil: It was predicted last year that the US would surpass Saudi Arabia as the largest oil producer by 2017. It now seems that this will happen in 2015. This is not to say that this is the end of Middle Eastern oil. Shale oil in the US will grow but will almost exclusively be used nationally to meet the domestic consumption demand.

Consumption is also increasing in Asia and Middle Eastern oil is needed to meet this demand.

Renewables: The renewable energy market is growing everywhere in the world, especially in China. China is investing more in renewables than the US, all of Europe and Japan combined.

The expansion of non-hydrocarbon renewables depends on subsidies. Subsidies worldwide amount to approximately 100 billion USD, 60% of which are in Europe for on- and offshore wind and solar energy. This is set to double by 2035.

The issue of competitiveness

Before the shale gas revolution, gas prices between different regions were relatively similar. Now, EU and Japan natural gas prices are three and five times that of the US, respectively. This divergence will remain in place for many years, causing a structural issue for Europe and Japan. The big question now is if and how the EU will cope with this. Electricity prices are also increasing.

Location of Japanese nuclear power plants in 2006 - Source: PD-USGOV, Wikimedia Commons.

Location of Japanese nuclear power plants in 2006 – Source: PD-USGOV, Wikimedia Commons.

This divergence will impact the EU and Japan. Today, 52 Japanese nuclear reactors are stopped. The country is more reliant on imports and is recording its 17th month of trade deficit. Thirty million people in the EU are employed in energy intensive industries such as petrochemicals, aluminium and cement. This is a large portion of the EU’s economic output.

The change in energy prices will create clear winners (US, China) and losers (EU, Japan). If policies do not change, this will have a knock-on effect on the economy.

Conclusions

1) The global energy landscape is changing fast. Companies that cannot read these changes will become losers. Those who can see development coming and position themselves accordingly can benefit from this.

2) China and India will drive the growing dominance of Asia in the global energy demand.

3) New technologies are opening up new oil resources but the Middle East remains critical.

4) It is likely that the regional price gap for natural gas and electricity will remain significant for many years but there are ways to react. There is a need for efficiency policies to counteract these developments.

5) The transition to a more efficient, low-carbon energy sector is more difficult in tough economic times, but no less urgent.

The Water-Energy Nexus

The Water-Energy Nexus

Flo Bullough writes on the concept of the water-energy nexus; its implications for energy and water security and the impact of climate change and future planning and regulation. 

I first came across the concept of the water-energy nexus when the former UK Chief Scientific Advisor John Beddington discussed the interdependence of food, water and energy as part of his tenure at government: something he described as a ‘perfect storm’. Since then, much has been written about this topic and below is an overview of the issues as they relate to the geosciences.

Tarbela Dam on the Indus river in pakistan. The dam was completed in 1974 and was designed to store water from the Indus River for irrigation, flood control, and the generation of hydroelectric power. The use of water for power captures the interdependence of energy and water. Source - Wikimedia Commons

Tarbela Dam on the Indus river in pakistan. The dam was completed in 1974 and was designed to store water from the Indus River for irrigation, flood control, and the generation of hydroelectric power. The use of water for power captures the interdependence of energy and water. Source – Wikimedia Commons

Water stress and scarcity is one of the most urgent cross-cutting challenges facing the world today and is intrinsically linked with the need for energy.  Water is required for extraction, transport and processing of fuel as well as to process fuels, for cooling in power plants and for irrigation in the case of biofuels. While energy is required for pumping, transportation and the purification of water, for desalination, and for wastewater.  The interconnectedness is such that water and energy cannot be addressed as separate entities. This interdependence is termed the ‘water-energy nexus’, an approach which allows a more holistic assessment of energy and water security issues. Water scarcity is intensifying due to excessive withdrawal , whilst concern for energy provision is sparked by diminishing fossil fuel reserves and the built-in problem of CO2 emissions and climate change.

Over the last 50 years, the amount of water withdrawals has tripled while the amount of reliable supply has remained constant. This has resulted in depletion of long term water reservoirs and aquifers, most acutely in emerging economies with high population growth such as China, India and areas in the Middle East. Additionally, pressures such as the growing cost of fuel extraction, climate change and the of the energy mix has put pressure on the security of energy supply.

Map of the global distribution of economic and physical water scarcity as of 2006. Source - Wikimedia Commons

Map of the global distribution of economic and physical water scarcity as of 2006. Source – Wikimedia Commons

Energy limited by water

The energy sector relies heavily on the use and availability of water for many of its core processes. Resource exploitation, the transport of fuels, energy transformation and power plants account for around 35% of water use globally. Thermoelectric power plants are particularly thirsty and use significant amounts of water accounting for the majority of water use by the energy sector. In the USA in 2007, thermoelectric power generation, primarily comprising coal, natural gas and nuclear energy, generated 91% of the total electricity and the associated cooling systems account for 40% of USA freshwater withdrawals (King et al., 2008).

Of the different types of power plants, gas fired plants consume the least water per unit of energy produced, whereas coal powered plants consume roughly twice as much water, and nuclear plants two to three times as much. By contrast, wind and solar photovoltaic energy consume minimal water and are the most water-efficient forms of electricity production.

Comparative water consumption values by energy type. Data source - WssTP

Comparative water consumption values by energy type. Data source – WssTP

There has been much discussion over the variable CO2 contributions of different fuels but these can be misleading, as the consideration of water consumption (as opposed to withdrawal, see Link) is often omitted. For example, unconventional fracked gas is often presented as a preferable source of energy over coal due to its reduced associated CO2 emissions, but the extraction of fracked gas consumes seven times more water than natural gas, oil extraction from oil sands requires up to 20 times more than conventional drilling and bio fuels can consume thousands times more water due to the need for irrigation. Additionally, carbon capture and storage (CCS) technology has the capacity to remove CO2 from the system but is also estimated to need 30-100% more water when added to a coal fired power plant. Looking at carbon intensity alone may result in a scenario where electricity production is constrained by water scarcity, while global demand for electricity increases.

Water limited by Energy

The flipside to the need for water for energy production is the need for energy in order to produce and deliver water for drinking and other domestic, agricultural and industrial use. Domestic water heating accounts for 3.6% of total USA

Water treatment works. Source - Wikimedia Commons

Water treatment works. Source – Wikimedia Commons

energy consumption (King et al., 2008) while supply and conveyance of water is also energy-intensive and is estimated to use over 3% of USA total electricity. Energy is required at every step of the supply chain, from pumping ground water (530 kW h M-1 for 120 m depth), to surface water treatment (the average plant uses 370 kWh M-1) and transport and home heating (King et al., 2008). Water treatment will require even more energy with the addition of treatment technologies and purification measures.  Water companies in the UK report increases of over 60% in electricity usage since 1990 due to advanced water treatment and increased connection rates, and conservative estimates predict increases of a further 60-100% over 15 years in order to meet the myriad relevant EU directives. This increased energy use may result in displacement of the pollution problem from that in water bodies to build up of CO2 in the atmosphere.

Desalination

One of the most problematic developments in the competition for water and energy is the growth of desalination. It is used in areas suffering from water scarcity, but have viable energy sources to power the energy-intensive purification process. In areas such as the Middle East, the Mediterranean and Western USA, governments have increased their investment in desalination technology in order to secure a more stable water supply. However, the high-energy requirements, steep operational costs, wastewater disposal issues and large CO2 emissions often make this an unsustainable solution.

Desalination is often made economical through access to cheap, local energy sources and an abundant water source. This

Desalination can be very energy intensive. A view across a reverse osmosis desalination plant. Source - Wikimedia Commons

Desalination can be very energy intensive. A view across a reverse osmosis desalination plant. Source – Wikimedia Commons

usually precludes the adoption of desalination in many land-locked countries, as operational costs increase with distance from the water source. However, increased water stress is leading to calls for more ambitious projects such as the planned Red Sea-Dead Sea project (see an earlier Four Degrees post on this) to build a desalination plant and a 180 km pipeline through Israel, Palestine and Jordan.

Desalination can use 10-12 times as much energy as standard drinking water treatment, and is expensive, unsustainable and can lead to increased CO2 emissions (King et al., 2008). These undesirable effects have led to widespread opposition to desalination in areas such as California and Chennai, India. Utilising renewable energy resources, coupled with the use of saline or wastewater for cooling at the power plants, could make the process more sustainable.Water and energy are set to become increasingly interdependent, and by 2050 water consumption to generate electricity is forecast to more than double.

The Impact of Water Scarcity

Freshwater scarcity is a growing issue and by 2030, demand is set to outstrip

India is a very green and wet country courtesy of its regular monsoons but poor management and overexploitation has left is with problems with water scarcity. Source - Wikimedia Commons

India is a very green and wet country courtesy of its regular monsoons but overexploitation of its water resources has left it with problems with water scarcity. Source – Wikimedia Commons

supply by 40%. This is due in part to economic and population growth, but also the rise of aspirational lifestyles, which creates demand for more water-intensive products. This increase in demand will put additional pressure onto water-stressed regions, as well as intensifying current trans-boundary water conflicts. The issue of water shortages often intersects geographically with fragile or weak governments and institutions that may lack the capacity to put in place measures to address water security. In 2004, 29% of India’s groundwater reserves resided in areas that were rated semi-critical to overexploited. About 60% of India’s existing and planned power plants are located in water-stressed areas and there are plans to build a further 59 GW of capacity, around 80% of which will be in areas of water stress and scarcity.

Click on the image to watch an animation showing the average yearly change in mass, in cm of water, during 2003-2010, over the Indian subcontinent. Source - Wikimedia Commons

Click on the image to watch an animation showing the average yearly change in mass, in cm of water, during 2003-2010, over the Indian subcontinent. Source – Wikimedia Commons

Climate change impacts

Climate change presents a challenge to business-as-usual assumptions about future energy and water provision. Predicted major heat waves and droughts will add pressure to both water and energy security. Climate change is set to affect areas around the world in unprecedented ways; in southern Europe, temperatures are likely to rise, and drought will become more common in a region already vulnerable to water stress. Particularly in Spain, a country that derived 14.3% of its electricity production from hydropower in 2010, where hydroelectric plants have been under considerable stress in the last 20 years due to long running issues with drought (Perez et al., 2009;  Trading Economics, 2013). Power cuts caused by extreme weather events, which are expected to become more frequent, will affect areas that rely heavily on energy-intensive ground water extraction for drinking water.

The 2013 EIA Energy Outlook up to 2040 shows steady increases in the need for all fuel types for energy use. Source - Wikimedia Commons

The 2013 EIA Energy Outlook up to 2040 shows steady increases in the need for all fuel types for energy use. Source – Wikimedia Commons

What can be done?

The conflict between more water-intensive energy production and the water needs of a growing population, seeking a better quality of life, will exacerbate an already stressed water-energy nexus.Additionally, Climate change is now considered an issue of national security in many countries, threatening both people and the environment within and across state boundaries. For this reason, climate change mitigation and adaptation must be managed at a new strategic level, beyond that of national law making. A more holistic approach to management of environmental change, water and energy security will also be required.  It will also require strategic planning of water and energy security over much longer timescales than previously.New water and energy production plants must be sited with consideration for water withdrawal, consumption and local power accessibility in addition to future unpredictability in climate as the lifetime of such developments is several decades or more.

Regulatory Changes

Another important tool to address these issues is regulation. Current regulatory frameworks such as the European Climate and Energy Package and the Water Framework Directive (WFD) need to be developed in light of the water-energy nexus model. The EU is committed to 20-30% reduction in CO2 emissions by 2020 compared to levels in 1990, with reductions of up to 50% by 2030 and 80% by 2050 under negotiation. In contrast, the WFD requires additional treatment measures and this will need additional energy, exacerbating tensions between water and energy demand.

There are many policy instruments that can be used to regulate the role of water and energy management, such as water pricing and charges on carbon emissions to incentivise sustainable behaviour. A recent example of this includes the new  US Environment Protection Agency announcement that they will be limiting greenhouse gas emissions for all new electricity generating power plants for coal and gas.  The development of CCS technology could reduce the carbon footprint of power plants, but water consumption implications should be taken into consideration. Adoption of disincentives for certain types of land-use change and stricter building and engineering regulations could also be introduced to increase resilience against extreme weather.

The growing geopolitical issues of water location and scarcity will need to be managed through adaptable water sharing agreements, since many of the world’s largest and most important river basins, such as the Mekong River, which passes

Map of the Mekong River - The long and complicated route of the Mekong river and its intersection with many borders shows the complexity of water management. Source - Wikimedia Commons

Map of the Mekong River – The long and complicated route of the Mekong river and its intersection with many borders shows the complexity of water management. Source – Wikimedia Commons

through south-east Asia, cut across many borders. Co-management strategies such as shared water level and quality information will become important so as the water systems can be managed effectively. Governments must also improve their resilience to extreme weather conditions individually and collectively.

A greater focus on recycling energy- and water-intensive commodities would also alleviate water stresses when taken together with other measures. Education about recycling and water and energy conservation programmes could produce benefits, but also require investment and careful management.

This broad set of issues can only be effectively ameliorated through a holistic approach. A broad analytic framework is needed to evaluate the water-energy relationship, and this must be balanced with local policy contexts and different regulatory measures to ensure water and energy are sustainably managed in the 21st century.

A version of this post first appeared in the European Federation of Geologists magazine ‘European Geologist‘. 

References and Further Reading

Gassert, F., Landis, M., Luck, M., Reig, P., Shiao, T. 2013. Aqueduct Global Maps 2.0. Aqueduct, World Resources Institute. (accessed here in March 2013: http://aqueduct.wri.org/publications)

Glassman, D., Wucker, M., Isaacman, T., Champilou, C. 2011. The Water-Energy Nexus: Adding Water to the Energy Agenda. A World Policy Paper. (accessed here in March 2013: http://www.worldpolicy.org/policy-paper/2011/03/18/water-energy-nexus)

IEA World Energy Outlook 2011. (accessed here in March 2013: http://www.iea.org/newsroomandevents/speeches/AmbJonesDeloitteConference21MayNN.pdf)

King, C, W., Holman, A, S.,  Webber, M, E. 2008. Thirst for energy. Nature Geoscience, 1, 283-286.

Lee, B., Preston, F., Kooroshy, J., Bailey, R., Lahn, G. 2012. Resources Futures. Chatham House. (accessed here in March 2013: http://www.chathamhouse.org/publications/papers/view/187947)

Perez Perez, L., Barreiro-Hurle, J. 2009. Assessing the socio-economic impacts of drought in the Ebro River Basin. Spanish Journal of Agricultural Research, 7, No 2, 269-280.

Trading Economics. Electricity Production from Hydroelectric Sources (%of total) in Spain. (accessed here in March 2013: http://www.tradingeconomics.com/spain/electricity-production-from-hydroelectric-sources-percent-of-total-wb-data.html)

WssTP The European Water Platform. 2011. Water and Energy: Strategic vision and research needs. (accessed here in March 2013: http://www.wsstp.eu/content/default.asp?PageId=750&LanguageId=0)

Climate and Policy Roundup – January 2014

Climate and Policy Roundup – January 2014

News

  • EU announces climate and energy goals for 2030

The European commission has announced a target to reduce its emissions by 40% by 2030 compared to 1990 levels. It also stated that 27% of total energy production should come from renewable sources. The announcement came on 22 January following intense negotiations between its member states.

The European Commission, Brussels - Source: Sébastien Bertrand, Wikimedia Commons.

The European Commission, Brussels – Source: Sébastien Bertrand, Wikimedia Commons.

The 40% reduction is at the high end of the range of projected decisions, and is the toughest climate change target of any region in the world. The renewable energy target of 27% is an EU-wide binding agreement, meaning that individual states are not obliged to commit to increasing renewables to this level.

The decision to remove country-specific targets places faith in individual states to meet these targets.

The EU targets are the first to be announced ahead of the international meeting that will take place in Paris in 2015, where world governments will discuss a global framework to avoid dangerous levels of emissions and global warming. Every country is expected to announce its own emission and energy targets ahead of the meeting.

The UK energy and climate change secretary Ed Davey opposed the target but was overruled as other big member states such as France, Germany and Italy backed it.

More details and commentaries can be found on Carbon Brief. A step-by-step account of the day can be found on The Guardian website. You can watch the press conference here.

  • UK Chief Scientific Adviser talks climate

The UK Government Chief Scientific Adviser Sir Mark Walport will give a series of lectures on climate change at Science and Discovery Centres around the country. The tour will kick-off at the Museum of Science and Industry in Manchester on January 28th. It will continue throughout February and March 2014 with events in Bristol, Belfast, Birmingham, London and Edinburgh.

  • US sets greenhouse gas targets for power plants
A coal fired power plant in Minnesota. Source - Wikimedia Commons

A coal fired power plant in Minnesota. Source – Wikimedia Commons

The US Environmental Protection agency have recently published a rule that governs the limit of the amount of greenhouse-gas emissions that can be released from power plants. The rule effectively means that any new coal-fired power plants built in the US must capture and sequester around 40% of their emissions. This post on the Union of Concerned Scientists‘ website  focusses on the science around this new policy initiative.

  • The EU goes blue
Source: Wikimedia Commons.

Source: Wikimedia Commons.

The European Commission unveiled an action plan to harvest renewable energy from Europe’s Seas and Oceans, otherwise known as “Blue Energy”. This includes developing technologies to capture energy from waves, tides and temperature differences in the water. It is thought that the resources available in the world’s waters could exceed the world’s present and projected future energy needs. The Commission has set up an Ocean Energy Forum to address the challenges faced by the Blue Energy sector, including high cost of technology and complicated licensing rules.

  • Erratic weather over the festive season

There has been much written about the erratic weather and devastating flooding around the UK over the festive period. With particular focus on the impacts of the cuts in the Department of Farming and Rural Affairs and the Environment Agency and whether this would have an impact in the future. Now a new report says that spending plans have a £500 million shortfall over 25 years which could put more than 250,000 homes at risk. See the story on BBC News – Flood funds gap puts ‘250,000’ homes at risk’ 

  • More El Nino in a warming world
The 1997 El Nino seen by TOPEX/Poseidon. Source - Wikimedia Commons

The 1997 El Nino seen by TOPEX/Poseidon. Source – Wikimedia Commons

This week there have been a few stories on the mutual impact of Climate Change and El Nino. This article in Nature discussed how the frequency of extreme El Nino events could double as the world warms while others discussed concern over 2013 being the hottest year on record despite it not being an El Nino year, normally a key driver of hotter years.

  • Exploring one of the world’s most mysterious seas

The next big project for the International Ocean Discovery Program (IODP) is to unravel the geological history of the South China Sea. In particular, the project will focus on  the formation of the Sea, due to its unique position between the highest point on Earth in Himalayas and the deepest point, the Mariana Trench.

The South China Sea. Source - Wikimedia Commons.

The South China Sea. Source – Wikimedia Commons.

Research highlights

  • A distant connection between the North Atlantic Ocean and Antarctic sea ice
Antarctic mountains and pack ice - Source: Jason Auch, Wikimedia Commons.

Antarctic mountains and pack ice – Source: Jason Auch, Wikimedia Commons.

Temperature changes in the North Atlantic Ocean could directly influence the amount of sea ice in Antarctica, a new study has shown. This could explain the observed increase in Antarctic sea ice, despite the region experiencing the most pronounced amount of warming.

Researchers from the Courant Institute of Mathematical Science at New York University looked at satellite data, observations of ocean temperature and data from 18 Antarctic research stations. Using this data and a global atmospheric climate model, they found a relationship between decade-long winter temperatures in the North and tropical Atlantic surface waters and the concentration of Antarctic sea ice.

Their results suggest that the Atlantic Ocean could play an important role in influencing Antarctic climate, and should be taken into account when modelling future impacts of climate change.

The results were published in the journal Nature.

  • Ancient moss reveals Arctic warming unprecedented in 44,000 years
Baffin Islans - Source: Wes Gill, Wikimedia Commons.

Baffin Island – Source: Wes Gill, Wikimedia Commons.

Present-day temperatures in the Canadian Arctic are warmer than the natural historical variability of the past 44,000, researchers have suggested.

A team led by scientists from the University of Boulder, Colorado, collected and analysed 365 moss samples from 110 locations on Baffin Island in the eastern Canadian Arctic. The mosses were originally buried under ice and have been exposed by the recent warming of this region.

Radiocarbon dating of these biological samples suggested that the region is warmer now than in any century in the past 5000 years, and in some areas warmer than in the past 44,000 years. The authors conclude that human activities have led to unprecedented warmth in the region.

The results were published in the journal Geophysical Research Letters.

  • El Nino events twice as likely in a warming world

Higher surface water temperature in the eastern Pacific Ocean in a warming world could increase the frequency of extreme El Nino events, an international team of scientists has shown. Anomalous El Nino events can disrupt global weather patterns, causing catastrophic floods and droughts in different regions of western South America, as well as severely impact marine and bird life.

The research team used a series of twenty global climate models to simulate rainfall associated with extreme El Nino events during the twentieth and twenty-first centuries, up to the year 2090.

Their results suggest that extreme events will occur more frequently during this century than in the past due to climate change. This could lead to more occurrences of extreme weather, the authors warned.

The results were published in the journal Nature Climate Change.

Around EGU

Flo and Marion

Has climate change changed in the media?

Whether in a concerned, neutral, alarmist or sceptical tone, climate change is often reported in the media. But has the press approached this subject differently over the years? Marion Ferrat takes a look at the UK press coverage of the last two IPCC reports and investigates how the treatment of climate change has changed in British newspapers.

Glaciers outside of Ammassalik in Greenland - Source: Christine Zenino, Wikimedia Commons.

Glaciers outside of Ammassalik in Greenland – Source: Christine Zenino, Wikimedia Commons.

Last week, polling expert Leo Barasi posted the results of a very interesting study in his public opinion blog Noise of the Crowd. Following the waves of flooding that have hit the UK – and been at the centre of the UK press coverage – for the past month, he analysed the trends in flooding stories in the newspapers since 2005. He found that the number of news articles about flooding that also mentioned climate change dropped from 25% in 2009 to 11% last year.

This result reflects a broader trend in the public perception of climate change. Since the 2009 Copenhagen climate change conference, there has been a decrease in the number of people believing in human impacts on climate, and a rise in climate change scepticism.

One of the triggers of this change was the unfortunate email hacking incident at the University of East Anglia, commonly referred to as Climategate. In November 2009, over 1000 private emails between scientists of the Climatic Research Unit were stolen and released online. Some of these emails were interpreted as scientists hiding data in a bid to convince the world of the dangers of global warming. The controversy took the internet by storm and, although a careful investigation later showed that the scientists had not behaved in an untrustworthy way or manipulated any data, the damage was done.

The London Times, 6 July 1863 - Source: Wikimedia Commons.

The London Times, 6 July 1863 – Source: Wikimedia Commons.

After the release of the last IPCC report in September 2013, I carried out a similar analysis of climate change coverage in the UK press. I compared the press coverage of this fifth Assessment Report (AR 5) with that of the previous report (AR 4) in February 2007. Using a newspaper database called Factiva, I read all the news articles published in eight UK daily newspapers during the week of the two reports’ release1. Here is what I found.

News coverage of IPCC AR 4 and AR 5

The 5th Assessment Report (2013) saw less coverage than the 4th Assessment Report (2007), with 22 and 33 articles, respectively. The majority were published in The Times, The Guardian, The Independent and The Daily Telegraph. Over 80% of the news stories were covered by specialist science or environmental correspondents in 2013, against 48% in 2007.

Table1

What type of climate change?

I was interested in what was actually being reported in the press. Were journalists more concerned by air temperatures or ocean warming, or perhaps extreme events?

In 2007 and 2013, all newspapers talked about changes in temperature (64% in both years). Discussions of changes in sea level increased from 36% to 45% in 2007 and 2013, respectively, and climate extremes from 15 to 27%.

Coverage mentioning the oceans trebled from 9% in 2007 to 27% in 2013. This is interesting given the controversy surrounding the so-called “warming hiatus”. Global atmospheric temperatures have been relatively stable since 1998, and climate sceptics argue this is evidence that CO2 emissions do not dangerously affect temperatures. Scientists have suggested that the oceans have a complex role to play in modulating atmospheric temperatures.

But the most obvious change was the number of articles mentioning climate models. Despite being a central component of scientific results in both reports, references to models in the press were made in only 9% of the 2007 articles against 45% in 2013.

Table2

From scared to sceptical: a changing tone

In 2007, 42% of the articles across all news outlets but The Daily Mirror described the report as bleak, sobering, gloomy, frightening, grim, stark or terrifying. These adjectives were absent from the 2013 coverage, which rather used more neutral words such as most comprehensive, most authoritative or making the most overwhelming case (27% of the articles).

One big difference was the number of direct references to climate change scepticism or denial, which doubled from 30% in 2007 to 59% in 2013.

From cataclysm to careful concern in Britain

Newspapers such as The Daily Express, Daily Mail and The Sun were most concerned with consequences of climate change in Britain. Interestingly, these concerns were different in 2007 and 2013. The references were very sensationalist in 2007, with reports in The Daily Express, The Daily Mirror and The Sun that climate change “would devastate Britain”, which would face “disasters similar to the devastation […] caused by Hurricane Katrina”. They were more moderate in 2013, referring only to Britain likely experiencing “wetter winters and drier summers”.

Says who?

Quotes are an important part of a news article. They give weight to particular aspects of a story and enable journalists to convey opinions whilst maintaining the objectivity of their reporting.

In 2007, 39% of all articles contained quotes from scientists, rising to 55% in 2013. The percentage of articles containing quotes from politicians also rose from 36% to 41%. Most quoted politicians in each case were the Environment Secretary David Miliband (2007) and the Secretary of State for Energy and Climate Change Ed Davey (2013), both stressing the importance of climate change mitigation.

The largest change can be seen in the percentage of articles including quotes from climate change sceptics, which increased from 6% in 2007 to 27% in 2013.

Table3

What has changed?

Overall, the coverage of both IPCC reports was factual, detailed and accurate across all newspapers studied. The 5th Assessment Report saw less coverage than AR 4, suggesting a general dip in public interest in climate change. One interesting point was the discrepancy between the articles’ content and their titles in tabloid papers. Although the articles themselves were generally quite neutral, their titles voiced a much more pronounced scepticism. Given that most people would first and foremost read and remember an article’s title, their wording can have an important impact on public opinion.

The tone of the 2013 coverage was both less sensationalist (e.g. minimal use of words such as stark and terrifying) and more likely to include mentions of- and quotes by climate change sceptics.

In terms of scientific content, the main difference was the inclusion of the concept of climate models and their limitations and strengths in the 2013 press coverage (in 45% of articles against only 9% in 2007). This is possibly also in response to the ‘warming hiatus’, rather than because climate models have been a larger part of AR 5.

The political nature of the climate change debate was seen in the coverage of both IPCC reports, with over one third of the articles quoting politicians in both years.

The biggest difference was the much larger place given to climate change sceptics in the news coverage, nearly doubling from 30% in 2007 to 59% in 2013. Despite the increased certainty of the IPCC results from AR 4 to AR 5 (moving from 90% to 95% certainty that humans are influencing climate), it is clear that there is more room in the media today for uncertainty and climate change scepticism.

Marion

1This study covered the release of the Working Group 1 reports. News articles were selected from the News sections only, by searching for the terms climate change and either IPCC or Intergovernmental Panel on Climate Change.