EGU Blogs

Four Degrees

What’s Geology got to do with it? 1 – The Maya civilisation

What’s Geology got to do with it? 1 – The Maya civilisation

Geology is not just about looking at rocks. From finding oil and gas and tackling climate change to manufacturing, archaeology or geopolitics, geoscientists appear in most spheres of today’s world and economy, albeit often behind the scenes. In a new series of posts we will be looking at how geology relates to interdisciplinary or seemingly unconnected topics, which, at first glance, might seem like they have nothing to do with geology at all.

Earlier this year, Iain Duncan Smith (UK Work and Pensions Secretary) had a well publicised clash with geologists after saying in an interview on the Andrew Marr show regarding the legal battle of Cait Reilly – “The next time they go into their supermarket, they should ask themselves this simple question, when they can’t find the food they want on the shelves – who is more important – the geologist, or the person who stacked the shelves?” (see this excellent press release from the Geological Society in response). In way of response to this comment, this series will focus on the links between geology and the wider world and the importance of approaching problems from an interdisciplinary perspective. We hope to highlight the extensive reach of geology and how it can enrich our understanding of topics far outside of the traditional subject area.

1. The Maya civilisation

For our first post in the series we have chosen to look at the pre-Columbian Maya Civilisation, partly inspired by a recent story on the discovery of a large Mayan sculpture in a Guatemalan archaeological site .

Tikal Mayan ruins in Guatemala. Credit - chensiyuan, WIkimedia Commons.

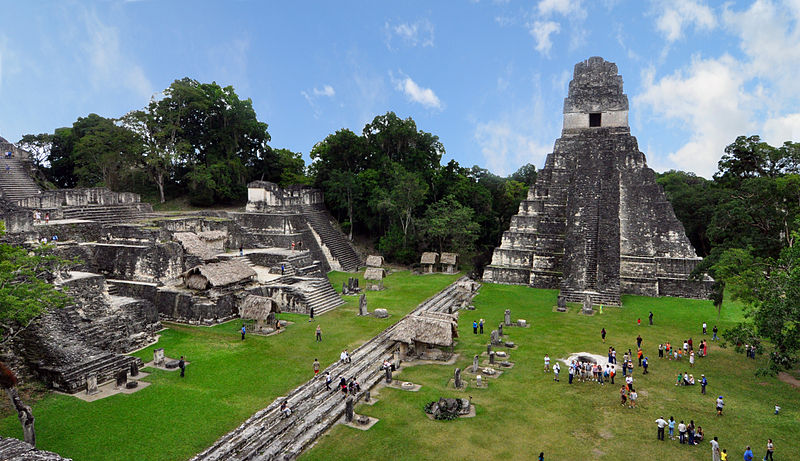
Tikal Mayan ruins in Guatemala. Credit – chensiyuan, WIkimedia Commons.

The Maya Civilisation can be traced as far back as 2000 BC and occupied southern Mexico and northern Central America (including the modern territories of Guatemala, Belize and Honduras). It prospered until 900 AD and continued until the arrival of the Spanish. Their golden age between 300 and 900 AD is a period characterised by flourishing art and architecture as well as developments in mathematics and astronomy. Mayan cities are dotted throughout Central and South America, the more famous sites include Chichen Itza and Palenque in Mexico and Tikal in northern Guatemala (see this map of the geography of the Mayan civilisation).

So… How does geology relate to this great civilisation? Elements of geology came into the daily lives of the Mayans in many forms through their building materials, the siting of their cities and the materials and minerals they used for trading, building infrastructure and creating objects used in their everyday lives. Climate change may also have greatly influenced the Mayan people and is thought to have led to both the expansion and the disintegration of this civilisation. We take a look at these different aspects below.

Siting of Mayan cities

The name of the city ‘Chich’en Itza’, located in Mexico, means ‘At the mouth of the well of Itza’. This refers to its location close to several ‘Cenotes’ (or in English, sink-holes). Sinkholes are cavities in the ground, often in limestone formations, caused by water erosion – these have received a lot of press recently due to their building swallowing activity! Find out more about sinkholes here. It’s thought that Cenotes provided access to the underworld, due to the discoveries of skeletons in sinkholes and caves near to archaeological sites. The cenotes were also fed by underground rivers, which provided water for the population.

Cenotes

Cenotes at Chichén Itzá, Yucatán Peninsula, Mexico. Credit – Emil Kehnel, Wikimedia Commons.

Building and Architecture

Mayan cities grew by using sacbeob (white roads, or limed causeways)  to connect great plazas and temples. These were made from limestone  due to its ease of handling and local availability.  Stone for buildings was taken from local quarries. Limestone was preferentially used because it was easy to remove using the stone tools available and because it could be used to make mortar through crushing and burning. Limestone was also used for both mortar and stucco.

Agriculture and Natural Hazards

Map of Guatemala volcanoes. Credit - USGS, Wikimedia Commons.

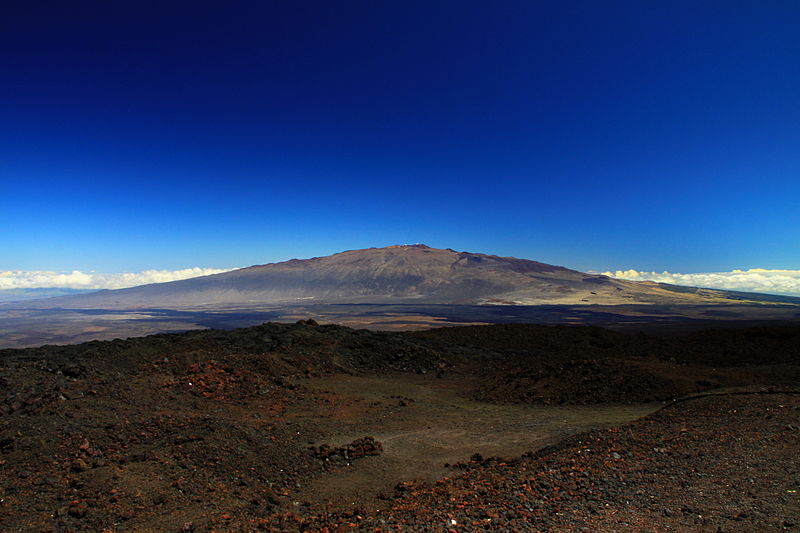
Map of Guatemala volcanoes. Credit – USGS, Wikimedia Commons.

One might expect a civilisation that prospered over a long period of time to have developed a thriving agriculture to meet the needs of an expanding population. But limestone is the dominant rock type in the area and does not usually generate good soil. Many Mayan cities are therefore believed to have had poor soils which puzzled scientists and archaeologists as to how they could sustain such great cities.

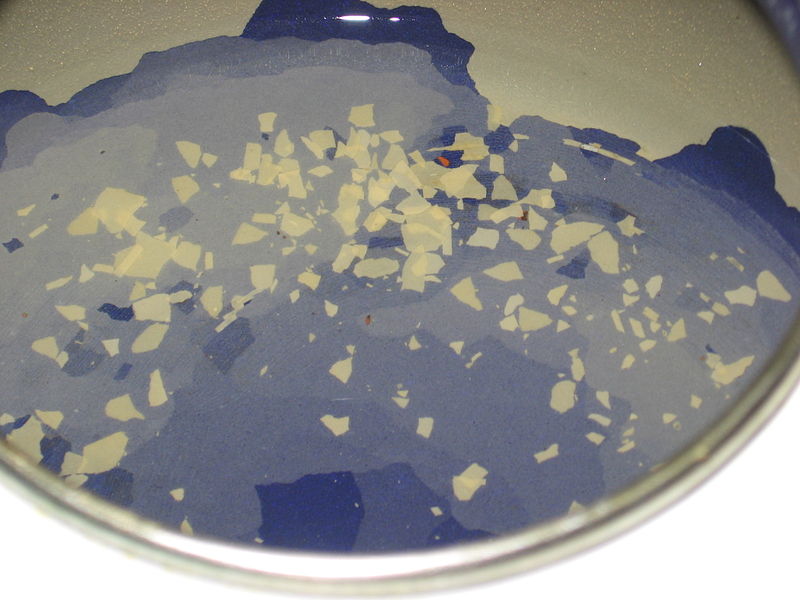
In a recent article in National Geographic, it was suggested that volcanic ash had been ‘spectacularly important’ in Mayan agriculture. Recently scientists discovered a distinct beige clay mineral, a type of smectite (the same mineral recently found on Mars!), in ruined canals at Guatemala’s Tikal archaeological site—once the largest city of the southern Maya lowlands. Chemical fingerprinting techniques were used to show that the smectite at Tikal didn’t come from dust carried over from Africa by air currents as previously thought but from volcanoes within what are now Guatemala, El Salvador, Honduras, and Mexico. The volcanoes in this region are produced by subduction of Pacific oceanic crust beneath the North American and Caribbean Plates. Volcanoes also brought their fair share of disaster to the Mayans. A village in El Salvador was completely buried when the nearby Ilopango volcano erupted in the 6th century A.D, not unlike the more famous Mt Vesuvius eruption in 79 AD, which buried the cities of Pompeii and Herculaneum.

Commodities, trade and minerals

Jadeite Pectoral from the Mayan Classic period. Credit - John Hill, Wikimedia Commons.

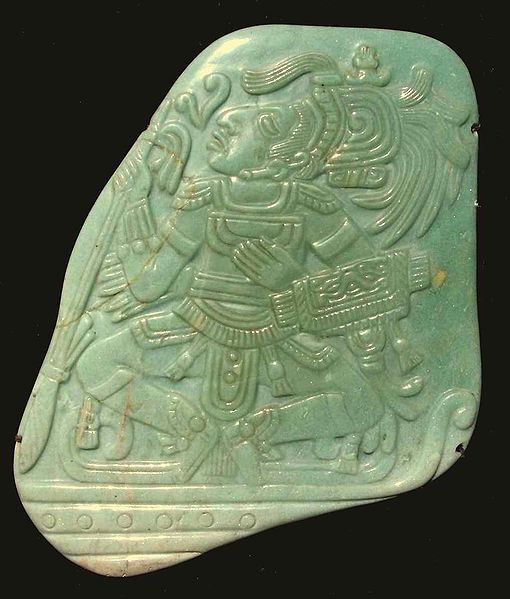
Jadeite Pectoral from the Mayan Classic period. Credit – John Hill, Wikimedia Commons.

Trade of commodities and minerals was a crucial factor in Mayan society. Trade centred around foodstuffs and raw materials including limestone, jade, marble, copper and gold. Goods such as jade, pyrite and fine ceramics were used to show power and primarily catered to the wealthy. The minerals jade and pyrite were collected in the highlands of Central Guatemala, made up of two mountain chains running from west to east. The area is made up of large stratovolcanoes and many basaltic volcanic fields (more information on the mountains and volcanoes of Guatemala can be found here).

Also important, was the volcanic glass obsidian which was used to make tools for cutting. Initially these minerals were only used locally to where they were sourced, but all of them eventually ended up being traded long distance.

Climate change and the fall of the Maya empire

The reasons for the collapse of the Mayan civilisation have troubled archaeologists and scholars for years. It has been attributed to a number of different factors, including internal warfare, foreign intrusion, agriculture, disease, environmental degradation and climate change. During the mid 1990s, scholars began to propose that extended drought and lack of water during the period from 750-1000 AD was the principal cause of the disintegration of the major Mayan centres and the collapse of the civilisation. The first geological evidence that this may have been the case came from sediment cores drilled from lakes on the Yucatan Peninsula, now in southern Mexico (and home to the famous Chicxulub crater).

Map of the Maya civilization cultural area. Credit - Sémhur/Wikimedia Commons.

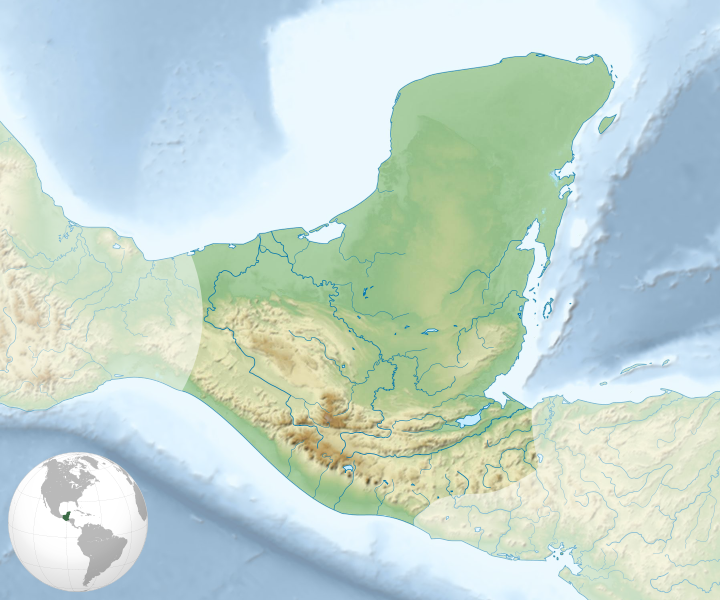
Map of the Maya civilization cultural area. Credit – Sémhur/Wikimedia Commons.

In a paper published in the journal Quaternary Research in 1996, Jason Curtis and his colleagues presented results from sediment cores drilled in Lake Punta Laguna in Yucatan. They used the oxygen isotope composition of the shells of organisms found in different sediment layers to show that the end of the Mayan civilisation coincided with consistently dry climate between 800 and 1000 AD, with particularly dry years overlying a general drying trend.

The oxygen composition of lake water is an important tool for understanding changes in the hydrological cycle in an area. A molecule of water, H2O, can be made of the more dominant light oxygen isotope 16O or the heavier 18O. In a closed-basin system such as the Yucatan lakes, the oxygen composition of the water (i.e. the ratio of 18O to 16O water molecules) is thought to primarily reflect changes in the balance between evaporation and precipitation. During dry periods, when precipitation is low and evaporation high, the lighter 16O isotope is more easily evaporated and preferentially removed from the water, leaving the heavier 18O in the lake. Dry periods are therefore characterised by a heavier oxygen isotope ratio in the lake waters. During wetter periods, the opposite phenomenon occurs and the lake waters are characterised by a lower oxygen isotope ratio. The oxygen isotope composition of the water is reflected in the shells of organisms alive at each time. As they die and get deposited on the lake bottom, these organisms record a slice of climate information.

A stalagmite in the Witches' Cave, Argentina. Credit - Pablo Flores, Wikimedia Commons.

A stalagmite in the Witches’ Cave, Argentina. Credit – Pablo Flores, Wikimedia Commons.

This data was corroborated by later measurements in the Cariaco Basin of the southern Caribbean. In a paper entitled ‘Climate and the Collapse of the Maya Civilisation’, Haug and co-authors used the titanium (Ti) concentration of sediment layers to reconstruct the hydrological history of Central America during the first millennium AD. Titanium concentrations reflect riverine input to the basin and Ti is therefore deposited during wet periods, when runoff increases and terrestrial material gets driven towards the coast. The authors also found an extended dry period between 800 and 1000 AD, punctuated by particularly severe droughts around 810, 860 and 910 AD.

Last year, a third set of palaeoclimate data was published in Science by Kennett and co-authors. They measured oxygen isotope data in a cave in Belize. Cave deposits such as stalactites and stalagmites grow as water drips through the cave. The oxygen composition of the rainwater is reflected in these deposits and they provide a very high-resolution record of precipitation. Yet again, a dryer period was recorded between 660 and 1000 AD, during the collapse of the Maya Civilisation.

So from trade, to religion, agriculture and society, geology has helped researchers understand the evolution and demise of this great civilisation.

Flo and Marion


Melting, microbes and methane: Are we about to face a carbon apocalypse?

Marion Ferrat takes a look under the frozen layers of Arctic permafrost and discusses how these soils may come back to haunt us.

The vast plains of Siberian or Canadian permafrost are a sight to behold. Hundreds, sometimes thousands of miles of frozen soils cover these lands, a cold and barren environment. In places, however, this permafrost is slowly melting away as a result of rising temperatures. The problem with that is that permafrost contains carbon, a whole lot of carbon, about the same amount as is present in the atmosphere today. At the moment, this carbon is fixed inside on- and offshore frozen soils but researchers fear that permafrost melting could suddenly release it into our atmosphere. With CO2 emissions still on the rise and global temperatures steadily increasing, eyes have slowly turned towards these frozen carbon pools.

Permafrost and Arctic lakes of the Kobuk River valley, Alaska. Source - 16Terezka, Wikimedia Commons.

Permafrost and Arctic lakes of the Kobuk River valley, Alaska. Source – 16Terezka, Wikimedia Commons.


A comment published last month
 in the journal Nature woke many people up to the question of permafrost. The authors, experts in climate modelling, policy and management, estimated the impact on the global economy of a sudden methane release (or methane ‘pulse’) from thawing of offshore permafrost. Their results were rather explosive: the authors put an astounding $60 trillion price tag on thawing of the East Siberian Arctic Shelf permafrost over the next decades, labelling it an ‘economic time bomb’. Most of this cost will be borne by developing countries, they added. Now this is rather worrying.

Location of Northern Hemisphere permafrost. Glaciers and ice sheets are in violet and sea ice in light blue. Source - NSIDC, Wikimedia Commons.

Location of Northern Hemisphere permafrost. Glaciers and ice sheets are in violet and sea ice in light blue. Source – NSIDC, Wikimedia Commons.

The article caused quite a bit of commotion in the news world, with a flurry of articles showing varying degrees of agreement. It was discussed in The Guardian, including an interview of study author Prof Peter WadhamsThe New York Times and The Carbon Brief, amongst other sources. The Washington Post published a fiery criticism of the research, calling it a “misleading commentary”, which spurred a reply from Prof Wadhams.

The problem with simulating the impacts of permafrost thawing is that it is a very complex problem involving many components of the Earth system. I have experienced this first hand as a postdoctoral researcher in Beijing, desperately trying to improve permafrost simulations in my university’s model.

First of all, what exactly is permafrost?

The exact definition of permafrost is a layer of soil that remains at or below 0°C for at least two consecutive years. The uppermost layer of permafrost soils, what we call the active layer, is most sensitive to surface temperature changes and actually goes through an annual cycle of freezing in winter and thawing in summer. Below this active layer is the true permanently frozen permafrost, with all its estimated 1466 Gton (that’s one billion tons) of stored carbon. Yup, that’s quite a lot.

Where does all the carbon come from?

Our present day ice sheets were born during the last glaciation, between approximately 110,000 and 12,000 years ago. The peak of this glacial age around 22,000 years ago, when ice extent was largest, is called the Last Glacial Maximum. Permafrost also dates from this colder and dryer time. The frozen soils of the glaciation, with all their frozen leaves, plants and other sources of organic carbon, were slowly buried by sedimentation processes such as dust deposition from the atmosphere, alluvial deposition (the deposition of eroded loose sediment on land) and peat growth. This increased the thickness of the frozen soil, effectively locking away the carbon.

Ice extent in Eurasia during the Last Glacial Maximum. Source - Mangerud et al. (2004), Wikimedia Commons.

Ice extent in Eurasia during the Last Glacial Maximum. Source – Mangerud et al. (2004), Wikimedia Commons.


What happens when permafrost thaws?

Worms and other burrowing creatures are not the only inhabitants of soils. Deeper underground also live plenty of microscopic microbes, happily munching away at our precious carbon. Microbes, like us, release carbon when they breathe, a process called respiration. When soil becomes permafrost, microbial activity stops. This is what effectively removes the organic carbon from the carbon cycle, making it “unusable”. As permafrost thaws, microbial activity resumes, mixing the carbon and slowly moving it up towards the surface, where other living organisms will then contribute to releasing it to the atmosphere by respiration. This is only the first worry. Another big question is whether this carbon will be released as carbon dioxide (CO2) or methane (CH4). Methane is a less common but much more potent greenhouse gas, so the effect of a sudden and large-scale methane ‘pulse’ would be much more dramatic than a similar CO2 emission.

What are the difficulties in modelling permafrost?

Modelling permafrost evolution and associated carbon releases is difficult because climate models must be able to accurately simulate many different processes: land-atmosphere-ocean interactions, air temperatures, soil temperatures and intricate biogeochemical processes linked to respiration, all at once. That is no easy feat.

Now for all of these different aspects, we also need some measured data. The key to using climate models in general is that, before they can be used to make predictions, they need to be verified against real world data that has been directly measured on Earth. That is, modellers first try to get their models to reproduce what they already know. Only when they are satisfied that they can simulate the past and the present do they start to model the future.

Permafrost peatbog border in Storflaket, Abisko, Sweden. Source - Dentren, Wikimedia Commons.

Permafrost peatbog border in Storflaket, Abisko, Sweden. Source – Dentren, Wikimedia Commons.

Given the complexity of modelling permafrost, this means that we need a whole lot of data to verify our models. Air temperature is well recorded around the globe but we also need both spatial and temporal information on soil temperatures, microbial respiration and carbon fluxes from the ground to the atmosphere. Obtaining a good global coverage of all of these factors takes time, especially when we are talking about an annual process like permafrost thawing. More and more papers have been published in recent years and have populated our global dataset of permafrost-related data. Just last month, a study published in Nature provided new data on changes in the carbon stock in Greenland permafrost from 1996 to 2008, as well as results from laboratory thawing experiments.

Dr Kevin Schaefer, from the National Snow and Ice Data Centre (NSIDC), is a bit of a pioneer in permafrost modelling. He helped me when I was working on improving my soil temperature model in Beijing and showed me how intricate the problem was and how much still needed to be improved to accurately simulate permafrost dynamics. He and his colleagues have been working on all aspects of permafrost science for some years now and their papers can provide much information on recent developments.

So the complex nature of permafrost, and the relative novelty of including permafrost in models, is why the range of estimates is still relatively wide. As with every type of model result, this is not to say that scientists disagree on the fundamental processes: there is plenty of frozen carbon, the Earth is warming, if it continues to do so the permafrost will thaw, thawing will eventually lead to a carbon release. We know it happened in the past (see this study published in Nature last year) and it can happen again.

The only question in my opinion is will it be in the next few decades or the ones after that. Many groups around the world are working on measuring, monitoring and modelling permafrost and there is yet to be published a comprehensive, scientific review paper on the latest results of these works. Perhaps such a review would be helpful to communicate the state of our knowledge to the public and policy-makers, and draw attention to yet another part of the Earth system, which will surely be affected by our increasing emissions and transform our world in return.

Marion Ferrat

Murky waters – what counts as good water quality?

Murky waters – what counts as good water quality?

Flo Bullough discusses the meaning of good and bad water quality, what’s in our tap water and what policies control the content of drinking water.

Pressure on water supply and quality has been high on the public and media agenda over the last 18 months. The widely publicised drought in early 2012, recent reports that we are due to run out of clean water in this generation and the controversy around potential contamination from fracking and the water industry itself have got a lot of people talking about good and bad water quality.

Water is the most important, interesting and unique compound on the planet. In addition to its necessity for all life, it also plays a fundamental role in industry and agriculture. For this reason the provision of reliable supplies of water of an adequate quality is imperative for health and for the economy. Geoscientists and hydrogeologists are involved at many stages in the water provision process, including characterising the geology and geochemistry of groundwater and surface water systems, identifying contaminants and the development of materials for the remediation of polluted drinking water.

Water_cycle BIG

Water carries the signature of the many parts of the water cycle it has passed through and so is never as simple as H2O. Source – USGS, Wikimedia Commons

What’s in our water?

For a water scientist, the purity of water is considered differently depending on its intended use. For the purpose of this post, I’ll be looking at what’s required to make drinking water ‘fit for use’ which applies to all water intended for human use. 100% pure water is the compound H2O, but in nature, however, this doesn’t exist as water acts as the universal solvent and is often a much more complex and heterogeneous mixture of dissolved salts, inorganic and organic compounds and bacteria. This is due in part to the extremely variable nature of the geology and soil that water interacts with. Water is as unique and variable as the geological strata through which it passes creating a fingerprint of the local geology.

The dissolved minerals in water such as magnesium and calcium bicarbonate is what clogs up our kettles! Source -

The dissolved minerals in water such as magnesium and calcium bicarbonate is what clogs up our kettles! Source – Julo, Wikimedia Commons.

It is the impurities it collects along the way that make the difference between hard and soft water; hard water contains more calcium and magnesium bicarbonate (leading to that nasty build up in your kettle!) but has no negative impact on health. Many of these impurities are either completely harmless or exist at concentrations below those posing a risk to health.

Some of these components create better tasting and higher quality water such as a balanced amount of magnesium, potassium, calcium and silica – chlorine, on the other hand, often ruins the taste of water. In addition to the compounds and chemicals that enter the water system in the environment, many water companies also add certain chemicals to drinking water. At the disinfection step, chlorine is often added to remove harmful bacteria, and some of this chlorine remains in the water until the point of consumption to ensure the water remains fresh as it makes its way through the pipe network. An issue of long-standing controversy is the addition of fluoride to drinking water. Fluoride is typically added to reduce tooth decay but its wider impacts have been debated extensively. Fluoride is a complex issue in that it can have beneficial health impacts at low concentrations (0.5 – 1 parts per million (ppm)) but acts as a contaminant at slightly higher doses. The threshold set by the World Health Organisation (WHO) guidelines is currently 1.5 ppm. The intense debate around this has led many countries to stop artificial fluoridation of their drinking water.

Areas with groundwater fluoride concentrations above 1.5ppm. Source - Eubulides, Wikimedia Commons.

Areas with groundwater fluoride concentrations above 1.5ppm. Source – Eubulides, Wikimedia Commons.

It is largely not practiced in Europe with the exception of Ireland, Spain, Switzerland and the UK, where approximately 5.8 million people receive artificially fluoridated water.  This variability in the UK is accounted for by the differing regional policies on fluoridation.

How do we define contamination and where do contaminants come from?

Rio_tinto_river_CarolStoker_NASA_Ames_Research_Center

Some water contamination is very colourful and visible such as Acid Mine Drainage seen here in Rio Tinto, Spain. Source – Carol Stoker, NASA, Wikimedia Commons.

Contamination can occur in many forms. It may or may not be visible to the naked eye and it can occur at very low concentrations (in the parts per billion range) or at much higher concentrations. This has implications for the wider public and policy-makers in communicating and understanding the issues around water contamination and decontaminating drinking water since the presence of contamination is often far from obvious. Contamination in drinking water is assigned by threshold values: since at least trace amounts of most elements are found in drinking water due to reasons discussed above. It is only when the concentrations of these chemicals exceed an assigned threshold that there is cause for concern. Contamination is normally defined by comparing concentrations in freshwater to a set of pre-determined evidence-based threshold limits that protect humans, flora and fauna from harmful levels of certain chemicals. These contaminants can come from a wide range of sources: acute spills associated with point sources such as industry, acid mine drainage and landfill – often coined anthropogenic sources – but also natural sources, where contamination is geogenic is origin, i.e. naturally present at elevated of harmful concentrations. Geogenic sourced contaminants can be unleashed through the drilling of wells for groundwater as seen in the arsenic crisis in Bangladesh.

What are the current policies covering water quality and its improvement?

800px-Assorted_pharmaceuticals_by_LadyofProcrastination

The restriction of pharmaceuticals in drinking water could incur high financial and energy costs. Source – LadyofProcrastination, Wikimedia Commons.

Substances which pose a risk to the aquatic environment are regulated in the Water Framework Driective at EU level and member states are requried to control these substances and prevent concentrations exceeding the threshold limit. There are currently over 50 standards to which drinking water is compared and these are listed by the Drinking Water Inspectorate (DWI) in the UK. The job of the DWI is to ensure that private water companies are producing water to the standards outlined in law. These health-based standards derive from those outlined by the EU in 1998 (with the exception of a few national limits), themselves based on strict guidelines outlined by the WHO. A recent inquiry carried out by the UK Government Science and Technology Committee investigated water quality threshold limits and the potential addition of new chemicals to the list of controlled substances. The main concerns were the inclusion of pharmaceutically-derived products to these legal thresholds, the extent of damage they cause, and the financial and energy costs of treating wastewater to remove them.

Problems with threshold limits

Clearly, the protection and decontamination of drinking water is of high importance in the context of a growing population and environmental change. However, adherence to current limits – which can be prohibitively low – and extension of the controlled substances list has complicated implications. Firstly, threshold limits can be extremely low, sometimes sitting at or below the levels which can be measured with current instrumentation. This can make the monitoring of contaminants both difficult and expensive, particularly in developing coutnries where sophisticated analysis instruments may not always be available. Additionally, many people argue that threshold limits are too low due to their basis on risk-derived limits and the lack of clear or ample toxicological or epidemiological studies to aid in deriving the standard value.

As issues of water and energy provision continue to converge in a difficult economic climate, knock-on impacts to intensive water remediation will only become a more important consideration for decision makers. The challenge now is to effectively communicate and manage the intensifying water issues associated with water security and quality in the light of economic factors, feasibility and the rising cost of energy.

Four degrees: Discussions on climate change, policy, environmental geochemistry and sustainability

As we enter the 400ppm world for the first time in a good chunk of geological history, issues of environment, sustainability and climate change are, more than ever, a source of discussion – and often heated dispute – in the media. As these issues are debated by governments and policy-makers, hardly one day goes by without a series of news articles on topics such as shale gas, warming climate, deforestation or renewable energy, to cite but a few.

View from the Mauna Loa observatory in Hawaii. Photograph distributed under a CC-BY 2.0 license.

View from the Mauna Loa observatory in Hawaii, where atmospheric CO2 concentrations exceeding 400 parts per million were recorded in May 2013. Photograph by Nula666.

According to the recent 2012 World Bank report, some of the consequences of a world 4°C warmer would include extreme summer heat waves, sea level rise which would impact vulnerable coastal states such as Madagascar or Bangladesh, stressed agricultural and water resources and displaced populations. The international community has vouched to limit future warming to 2°C but uncertainties are still large: uncertainties in climate model predictions and in ecosystem response, though the consensus is pretty clear among environmental and climate scientists that humans are driving much of the observed changes, but also uncertainties in what actions leaders will take to meet this aim.

A number of recent environmental policy issues are being debated in governments around the world and have had much coverage in the media: The Keystone XL project has seen a flurry of recent discussion and has been tagged a defining decision in Barack Obama’s environmental legacy. The plan to rescue the European Union’s carbon trading scheme was rejected by the EU commission in April 2013 but might yet be open for another vote. Carbon Capture and Storage, or CCS, is considered an important technology to put in place if carbon emissions are to be slowed down while maintaining fossil fuels as energy sources. Yet, action is slow in Europe and the UK.

While all of these discussions and debates are taking place, scientists around the world continue to carry out their

The Larsen ice shelf in Antarctica, viewed from NASA's DC-8 aircraft. Photograph by Jim Ross for NASA, distributed under a  CC-BY 2.0 license.

The Larsen ice shelf in Antarctica, viewed from NASA’s DC-8 aircraft. Photograph by Jim Ross for NASA.

research and to publish their findings in the scientific literature. Sometimes, such as with climate model research and estimates, publications are quickly picked up by the media and policy-makers and incorporated into the wider discussion. In other cases, it seems that policy-making and scientific research follow parallel routes without much interaction. So where do these issues fit in with the current geo-scientific research?

Four degrees aims to explore topical issues in environmental geoscience and climate change research and consider current themes in environmental policy from an inter-disciplinary perspective. The blog will discuss ideas and concepts from the fields of climate change, policy, environmental geochemistry and sustainability, mixing discussions on the latest developments in scientific research, the scientific concepts behind environmental geoscience and how geoscience problems relate to big environmental issues and feed into politics, policy and governance.

So welcome to Four Degrees. Four degrees of geoscience, four degrees of warming and hopefully a thousand degrees of discussion. We hope you will enjoy it and look forward to your comments!

Flo and Marion