Flo Bullough writes on the concept of the water-energy nexus; its implications for energy and water security and the impact of climate change and future planning and regulation.
I first came across the concept of the water-energy nexus when the former UK Chief Scientific Advisor John Beddington discussed the interdependence of food, water and energy as part of his tenure at government: something he described as a ‘perfect storm’. Since then, much has been written about this topic and below is an overview of the issues as they relate to the geosciences.
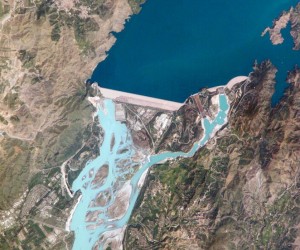
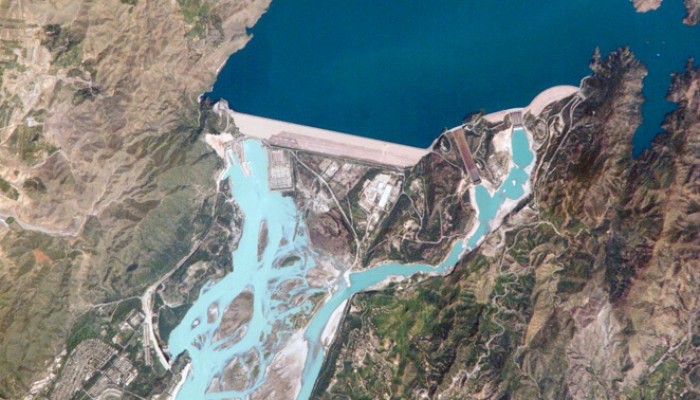
Tarbela Dam on the Indus river in pakistan. The dam was completed in 1974 and was designed to store water from the Indus River for irrigation, flood control, and the generation of hydroelectric power. The use of water for power captures the interdependence of energy and water. Source – Wikimedia Commons
Water stress and scarcity is one of the most urgent cross-cutting challenges facing the world today and is intrinsically linked with the need for energy. Water is required for extraction, transport and processing of fuel as well as to process fuels, for cooling in power plants and for irrigation in the case of biofuels. While energy is required for pumping, transportation and the purification of water, for desalination, and for wastewater. The interconnectedness is such that water and energy cannot be addressed as separate entities. This interdependence is termed the ‘water-energy nexus’, an approach which allows a more holistic assessment of energy and water security issues. Water scarcity is intensifying due to excessive withdrawal , whilst concern for energy provision is sparked by diminishing fossil fuel reserves and the built-in problem of CO2 emissions and climate change.
Over the last 50 years, the amount of water withdrawals has tripled while the amount of reliable supply has remained constant. This has resulted in depletion of long term water reservoirs and aquifers, most acutely in emerging economies with high population growth such as China, India and areas in the Middle East. Additionally, pressures such as the growing cost of fuel extraction, climate change and the of the energy mix has put pressure on the security of energy supply.
Map of the global distribution of economic and physical water scarcity as of 2006. Source – Wikimedia Commons
Energy limited by water
The energy sector relies heavily on the use and availability of water for many of its core processes. Resource exploitation, the transport of fuels, energy transformation and power plants account for around 35% of water use globally. Thermoelectric power plants are particularly thirsty and use significant amounts of water accounting for the majority of water use by the energy sector. In the USA in 2007, thermoelectric power generation, primarily comprising coal, natural gas and nuclear energy, generated 91% of the total electricity and the associated cooling systems account for 40% of USA freshwater withdrawals (King et al., 2008).
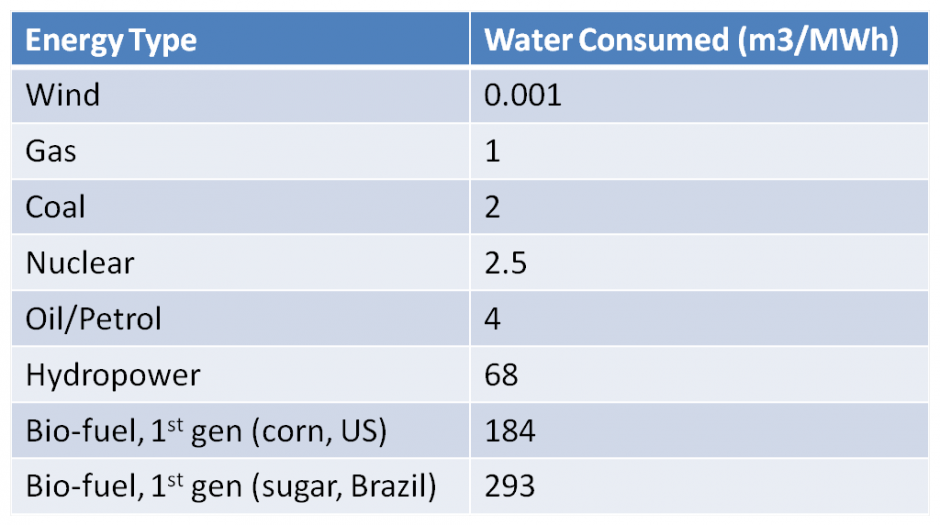
Of the different types of power plants, gas fired plants consume the least water per unit of energy produced, whereas coal powered plants consume roughly twice as much water, and nuclear plants two to three times as much. By contrast, wind and solar photovoltaic energy consume minimal water and are the most water-efficient forms of electricity production.
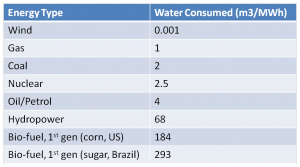
Comparative water consumption values by energy type. Data source – WssTP
There has been much discussion over the variable CO2 contributions of different fuels but these can be misleading, as the consideration of water consumption (as opposed to withdrawal, see Link) is often omitted. For example, unconventional fracked gas is often presented as a preferable source of energy over coal due to its reduced associated CO2 emissions, but the extraction of fracked gas consumes seven times more water than natural gas, oil extraction from oil sands requires up to 20 times more than conventional drilling and bio fuels can consume thousands times more water due to the need for irrigation. Additionally, carbon capture and storage (CCS) technology has the capacity to remove CO2 from the system but is also estimated to need 30-100% more water when added to a coal fired power plant. Looking at carbon intensity alone may result in a scenario where electricity production is constrained by water scarcity, while global demand for electricity increases.
Water limited by Energy
The flipside to the need for water for energy production is the need for energy in order to produce and deliver water for drinking and other domestic, agricultural and industrial use. Domestic water heating accounts for 3.6% of total USA
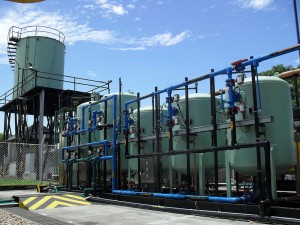
Water treatment works. Source – Wikimedia Commons
energy consumption (King et al., 2008) while supply and conveyance of water is also energy-intensive and is estimated to use over 3% of USA total electricity. Energy is required at every step of the supply chain, from pumping ground water (530 kW h M-1 for 120 m depth), to surface water treatment (the average plant uses 370 kWh M-1) and transport and home heating (King et al., 2008). Water treatment will require even more energy with the addition of treatment technologies and purification measures. Water companies in the UK report increases of over 60% in electricity usage since 1990 due to advanced water treatment and increased connection rates, and conservative estimates predict increases of a further 60-100% over 15 years in order to meet the myriad relevant EU directives. This increased energy use may result in displacement of the pollution problem from that in water bodies to build up of CO2 in the atmosphere.
Desalination
One of the most problematic developments in the competition for water and energy is the growth of desalination. It is used in areas suffering from water scarcity, but have viable energy sources to power the energy-intensive purification process. In areas such as the Middle East, the Mediterranean and Western USA, governments have increased their investment in desalination technology in order to secure a more stable water supply. However, the high-energy requirements, steep operational costs, wastewater disposal issues and large CO2 emissions often make this an unsustainable solution.
Desalination is often made economical through access to cheap, local energy sources and an abundant water source. This

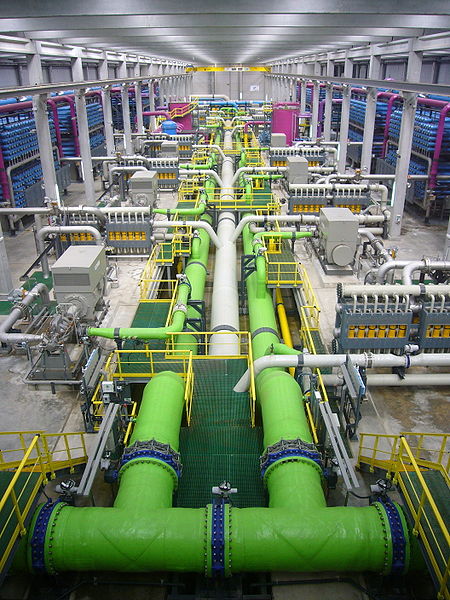
Desalination can be very energy intensive. A view across a reverse osmosis desalination plant. Source – Wikimedia Commons
usually precludes the adoption of desalination in many land-locked countries, as operational costs increase with distance from the water source. However, increased water stress is leading to calls for more ambitious projects such as the planned Red Sea-Dead Sea project (see an earlier Four Degrees post on this) to build a desalination plant and a 180 km pipeline through Israel, Palestine and Jordan.
Desalination can use 10-12 times as much energy as standard drinking water treatment, and is expensive, unsustainable and can lead to increased CO2 emissions (King et al., 2008). These undesirable effects have led to widespread opposition to desalination in areas such as California and Chennai, India. Utilising renewable energy resources, coupled with the use of saline or wastewater for cooling at the power plants, could make the process more sustainable.Water and energy are set to become increasingly interdependent, and by 2050 water consumption to generate electricity is forecast to more than double.
The Impact of Water Scarcity
Freshwater scarcity is a growing issue and by 2030, demand is set to outstrip
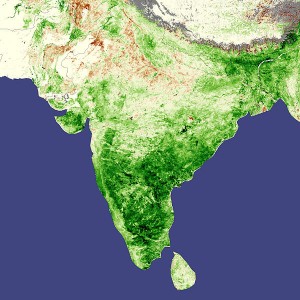
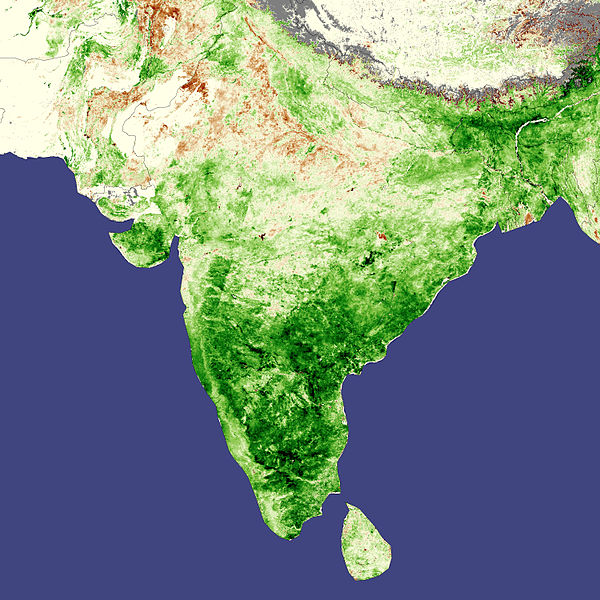
India is a very green and wet country courtesy of its regular monsoons but overexploitation of its water resources has left it with problems with water scarcity. Source – Wikimedia Commons
supply by 40%. This is due in part to economic and population growth, but also the rise of aspirational lifestyles, which creates demand for more water-intensive products. This increase in demand will put additional pressure onto water-stressed regions, as well as intensifying current trans-boundary water conflicts. The issue of water shortages often intersects geographically with fragile or weak governments and institutions that may lack the capacity to put in place measures to address water security. In 2004, 29% of India’s groundwater reserves resided in areas that were rated semi-critical to overexploited. About 60% of India’s existing and planned power plants are located in water-stressed areas and there are plans to build a further 59 GW of capacity, around 80% of which will be in areas of water stress and scarcity.
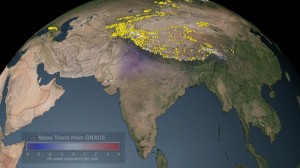
Click on the image to watch an animation showing the average yearly change in mass, in cm of water, during 2003-2010, over the Indian subcontinent. Source – Wikimedia Commons
Climate change impacts
Climate change presents a challenge to business-as-usual assumptions about future energy and water provision. Predicted major heat waves and droughts will add pressure to both water and energy security. Climate change is set to affect areas around the world in unprecedented ways; in southern Europe, temperatures are likely to rise, and drought will become more common in a region already vulnerable to water stress. Particularly in Spain, a country that derived 14.3% of its electricity production from hydropower in 2010, where hydroelectric plants have been under considerable stress in the last 20 years due to long running issues with drought (Perez et al., 2009; Trading Economics, 2013). Power cuts caused by extreme weather events, which are expected to become more frequent, will affect areas that rely heavily on energy-intensive ground water extraction for drinking water.
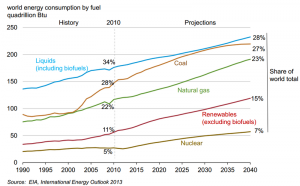
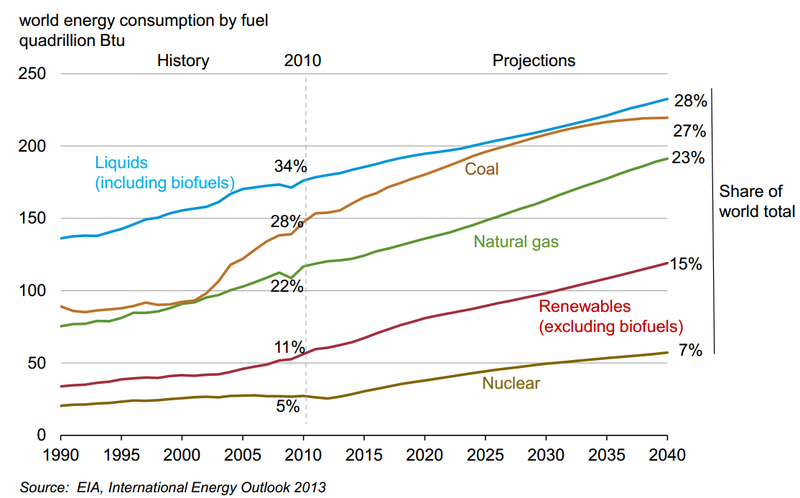
The 2013 EIA Energy Outlook up to 2040 shows steady increases in the need for all fuel types for energy use. Source – Wikimedia Commons
What can be done?
The conflict between more water-intensive energy production and the water needs of a growing population, seeking a better quality of life, will exacerbate an already stressed water-energy nexus.Additionally, Climate change is now considered an issue of national security in many countries, threatening both people and the environment within and across state boundaries. For this reason, climate change mitigation and adaptation must be managed at a new strategic level, beyond that of national law making. A more holistic approach to management of environmental change, water and energy security will also be required. It will also require strategic planning of water and energy security over much longer timescales than previously.New water and energy production plants must be sited with consideration for water withdrawal, consumption and local power accessibility in addition to future unpredictability in climate as the lifetime of such developments is several decades or more.
Regulatory Changes
Another important tool to address these issues is regulation. Current regulatory frameworks such as the European Climate and Energy Package and the Water Framework Directive (WFD) need to be developed in light of the water-energy nexus model. The EU is committed to 20-30% reduction in CO2 emissions by 2020 compared to levels in 1990, with reductions of up to 50% by 2030 and 80% by 2050 under negotiation. In contrast, the WFD requires additional treatment measures and this will need additional energy, exacerbating tensions between water and energy demand.
There are many policy instruments that can be used to regulate the role of water and energy management, such as water pricing and charges on carbon emissions to incentivise sustainable behaviour. A recent example of this includes the new US Environment Protection Agency announcement that they will be limiting greenhouse gas emissions for all new electricity generating power plants for coal and gas. The development of CCS technology could reduce the carbon footprint of power plants, but water consumption implications should be taken into consideration. Adoption of disincentives for certain types of land-use change and stricter building and engineering regulations could also be introduced to increase resilience against extreme weather.
The growing geopolitical issues of water location and scarcity will need to be managed through adaptable water sharing agreements, since many of the world’s largest and most important river basins, such as the Mekong River, which passes
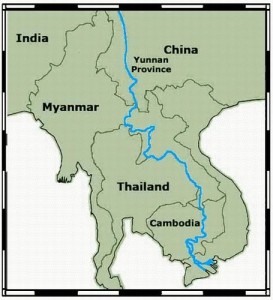
Map of the Mekong River – The long and complicated route of the Mekong river and its intersection with many borders shows the complexity of water management. Source – Wikimedia Commons
through south-east Asia, cut across many borders. Co-management strategies such as shared water level and quality information will become important so as the water systems can be managed effectively. Governments must also improve their resilience to extreme weather conditions individually and collectively.
A greater focus on recycling energy- and water-intensive commodities would also alleviate water stresses when taken together with other measures. Education about recycling and water and energy conservation programmes could produce benefits, but also require investment and careful management.
This broad set of issues can only be effectively ameliorated through a holistic approach. A broad analytic framework is needed to evaluate the water-energy relationship, and this must be balanced with local policy contexts and different regulatory measures to ensure water and energy are sustainably managed in the 21st century.
A version of this post first appeared in the European Federation of Geologists magazine ‘European Geologist‘.
References and Further Reading
Gassert, F., Landis, M., Luck, M., Reig, P., Shiao, T. 2013. Aqueduct Global Maps 2.0. Aqueduct, World Resources Institute. (accessed here in March 2013: http://aqueduct.wri.org/publications)
Glassman, D., Wucker, M., Isaacman, T., Champilou, C. 2011. The Water-Energy Nexus: Adding Water to the Energy Agenda. A World Policy Paper. (accessed here in March 2013: http://www.worldpolicy.org/policy-paper/2011/03/18/water-energy-nexus)
IEA World Energy Outlook 2011. (accessed here in March 2013: http://www.iea.org/newsroomandevents/speeches/AmbJonesDeloitteConference21MayNN.pdf)
King, C, W., Holman, A, S., Webber, M, E. 2008. Thirst for energy. Nature Geoscience, 1, 283-286.
Lee, B., Preston, F., Kooroshy, J., Bailey, R., Lahn, G. 2012. Resources Futures. Chatham House. (accessed here in March 2013: http://www.chathamhouse.org/publications/papers/view/187947)
Perez Perez, L., Barreiro-Hurle, J. 2009. Assessing the socio-economic impacts of drought in the Ebro River Basin. Spanish Journal of Agricultural Research, 7, No 2, 269-280.
Trading Economics. Electricity Production from Hydroelectric Sources (%of total) in Spain. (accessed here in March 2013: http://www.tradingeconomics.com/spain/electricity-production-from-hydroelectric-sources-percent-of-total-wb-data.html)
WssTP The European Water Platform. 2011. Water and Energy: Strategic vision and research needs. (accessed here in March 2013: http://www.wsstp.eu/content/default.asp?PageId=750&LanguageId=0)