In Heliophysics there is a scarcity of in-situ buoys that allows us to monitor and track the solar wind changes in our Sun’s atmosphere, the heliosphere. NASA’s Parker Solar Probe (PSP) mission is one of those buoys that, together with Solar Orbiter (SolO, ESA/NASA Collaboration), is bringing a breath of fresh air in the effort to fully characterize the solar wind and study the evolution of the embedded structures. These structures have different scales, but the large-scale structures are the cause of changes in the global heliospheric magnetic field configuration, defining thus boundary between the inner from the outer heliosphere. They are also the main cause of the Space Weather hazards, with strong impact in our technology and society, as well as in our ambition to explore the Solar System.
This progressive increase in space-based assets also provides a valuable combination of multiple perspectives of telescopic observations (remote-sensing observations) as well as many points of check-in (in-situ observations) that enable us to advance in the 3D understanding of the physical processes associated with the evolution of large-scale structures in the solar wind. Each of these multi-spacecraft observed events represent a precious opportunity to investigate the effect of large-scale structures on the inner heliosphere and track the internal changes before they become part of the solar wind as Eugene Parker (1958) envisioned. The authors of the paper that is the topic of this blog, focused their investigation on the analysis of the four successive Coronal Mass Ejections (CMEs) and their counterpart in the interplanetary medium (ICMEs) that occurred during 2020 November 24–29. The paper’s title is ‘Direct First PSP Observation of the Interaction of Two Successive Interplanetary Coronal Mass Ejections (ICMEs) in 2020 November’ and it was published in May 2022 in the Astrophysical Journal (Nieves-Chinchilla et al. 2022 ApJ 930 88).
Figure 1 shows a map depicting the locations of multiple solar–heliospheric spacecraft from 2020 November 29 to December 1 (during which the PSP detected the transit of the ICMEs). The PSP (orange) was moving from ∼96° to ∼97° east of Earth (green), 39° east of STEREO-A (red), and at a heliospheric distance of 0.81 AU from the Sun. Such configuration enabled the telescopic observation of successive CMEs that caused the spread of energetic particles in the inner heliosphere that even hit the SolO spacecraft, located at the back of the Sun as observed by PSP and not included in the Figure 1. Our investigation focused on the analysis of two CMEs (CME1 and CME2 listed in the Figure 1) since they were the only one that hit PSP and skimmed STEREO-A (NASA/ESA mission launched in 2006).
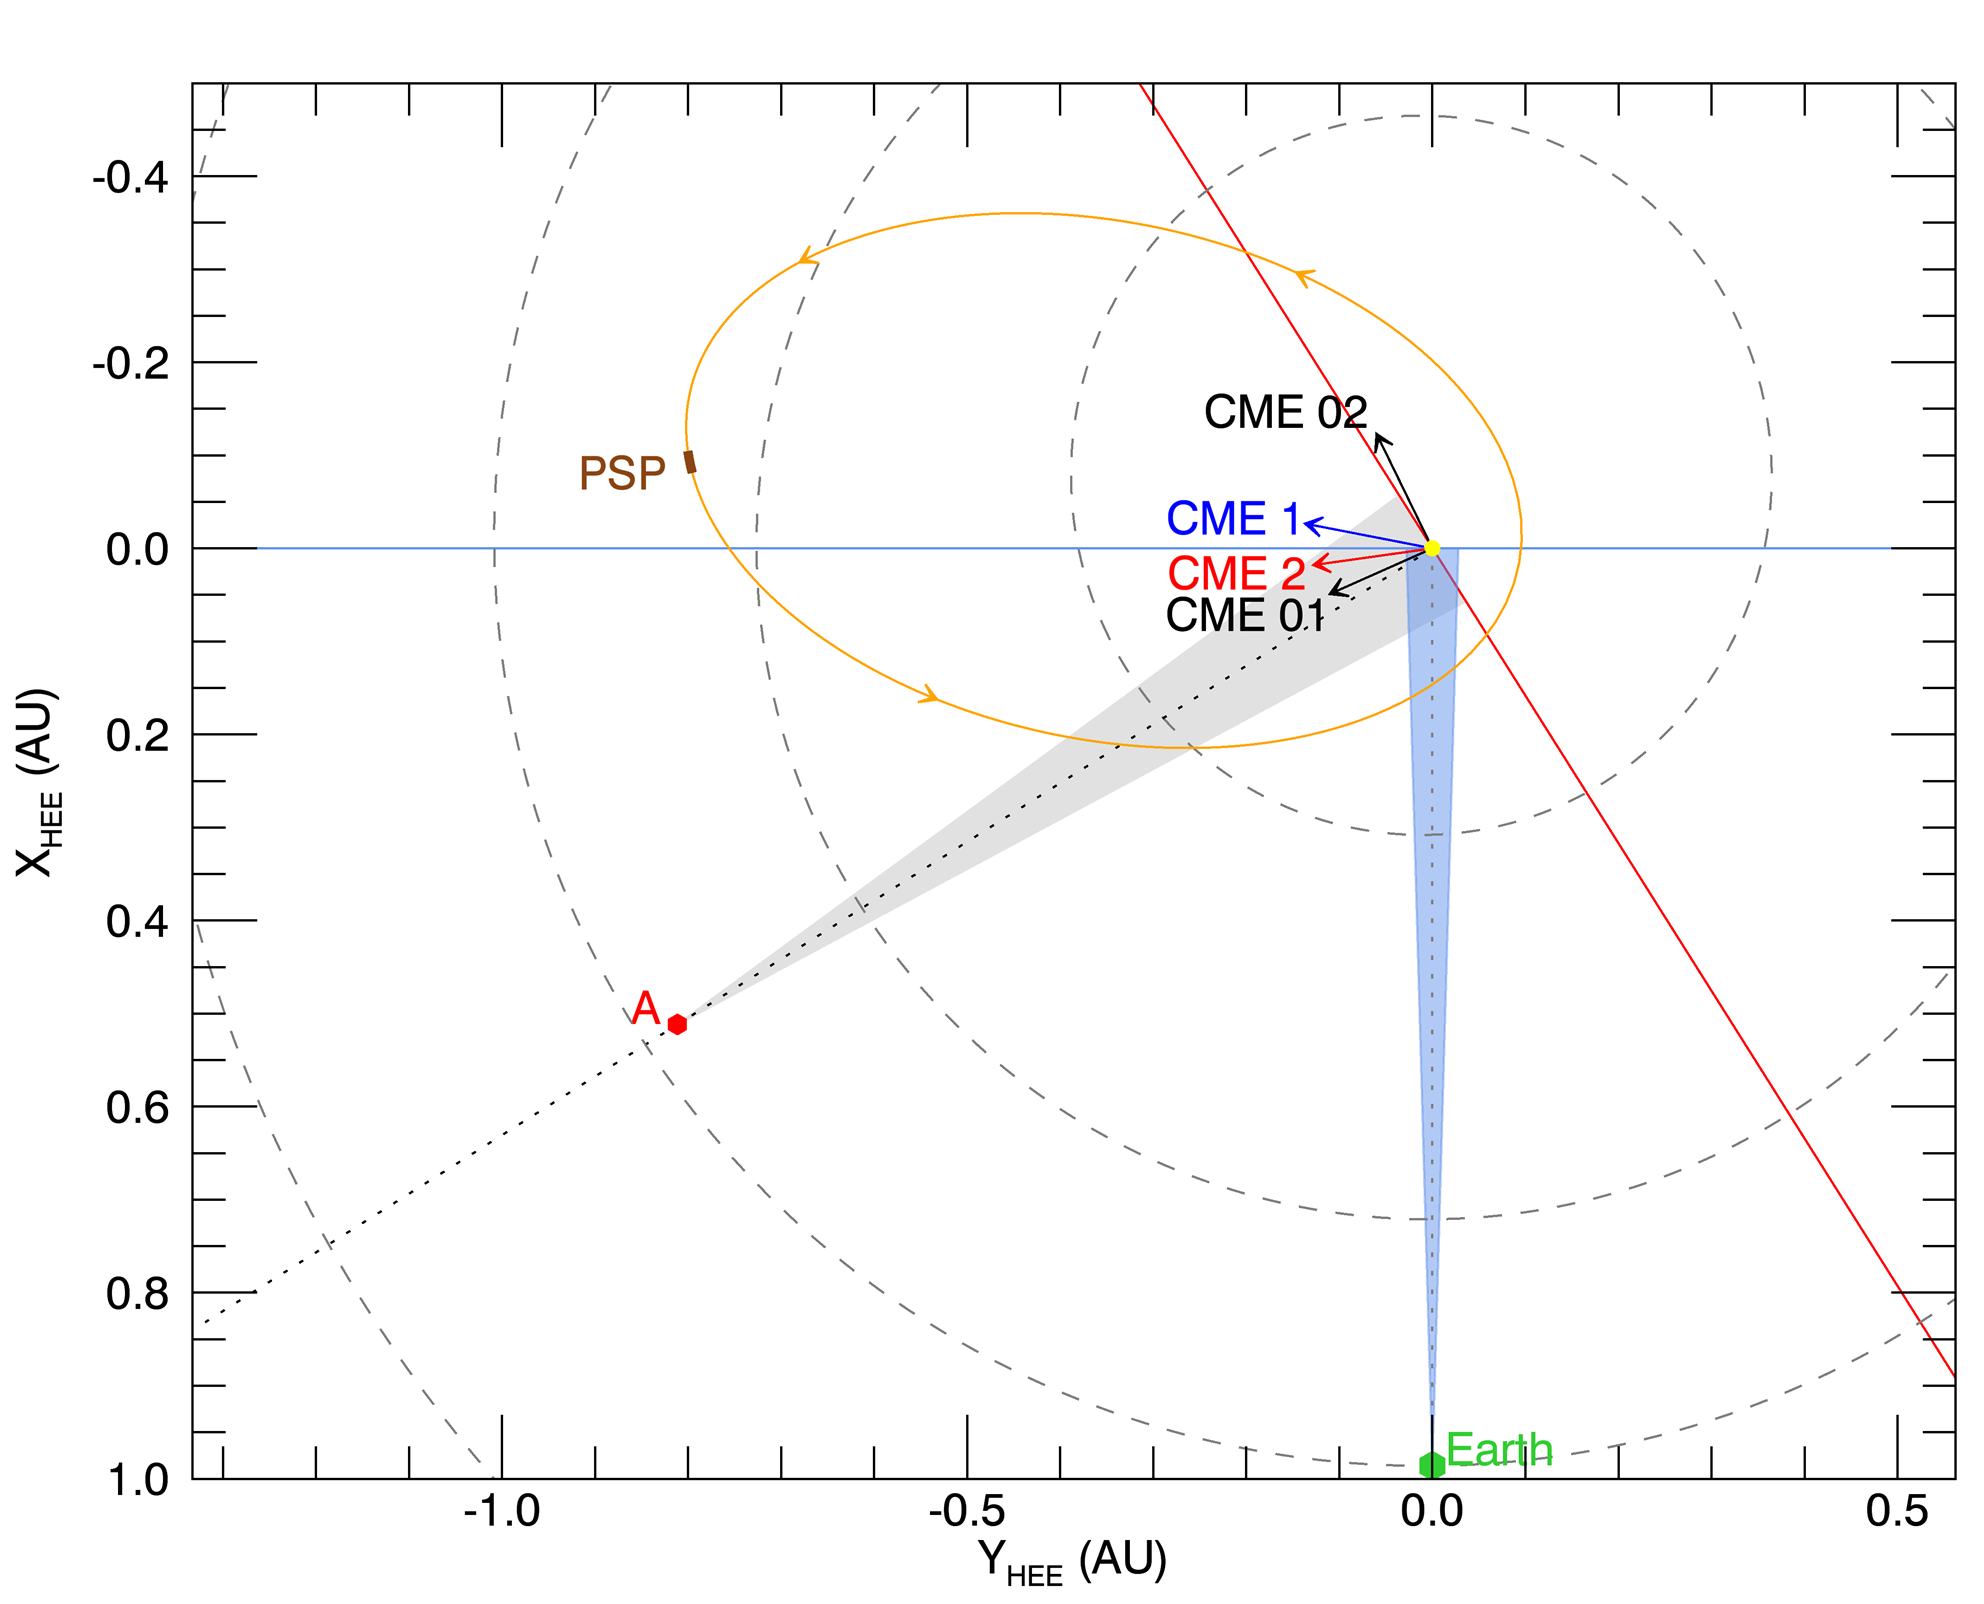
Map of the solar–heliospheric spacecraft location (during the November 29 to December 1 period) and capabilities: PSP (orange), STEREO-A (A; red), and Earth (green), which includes the STEREO-A/COR2 field of view in gray color and blue color for SOHO/C2 telescopes. The arrows represent the central direction of propagation of the four CMEs.
One of the first steps in this multi-spacecraft analysis is to recreate the scene of ICMEs transit in the heliosphere until reaching the spacecrafts, in this case PSP and STEREO-A. In this case, we needed to evaluate the impact of all CMEs in the first stages of the evolution and the influence of each other as they propagate and evolve in the heliosphere. From this exercise, we can certainly say that the main effort goes to synchronize observations, researchers, models, and techniques toward reconciling the global and local views. This is an arduous activity that requires the fluent communications among the team and takes the most part of the investigation. From this exercise we always get many lessons to learn since it stresses our understanding of the physical phenomena and uncovers the limitations and deficits of the techniques and models. Thus, one can start the research thinking of a goal for the study, but only this exercise to align resources is the one that really blows the whistle of which science gap the article will cover. In our case, our study revealed that we were facing the first direct PSP observation of an interaction of two successive ICMEs. The confirmation of this finding took several iterations between the CMEs reconstructions using a forward modeling technique on the remote-sensing observations and a numerical simulation of the CME propagating in the heliosphere to ensure the second ICME (CME2 in the Figure 1, ICME2 henceforth) reached STEREO-A.
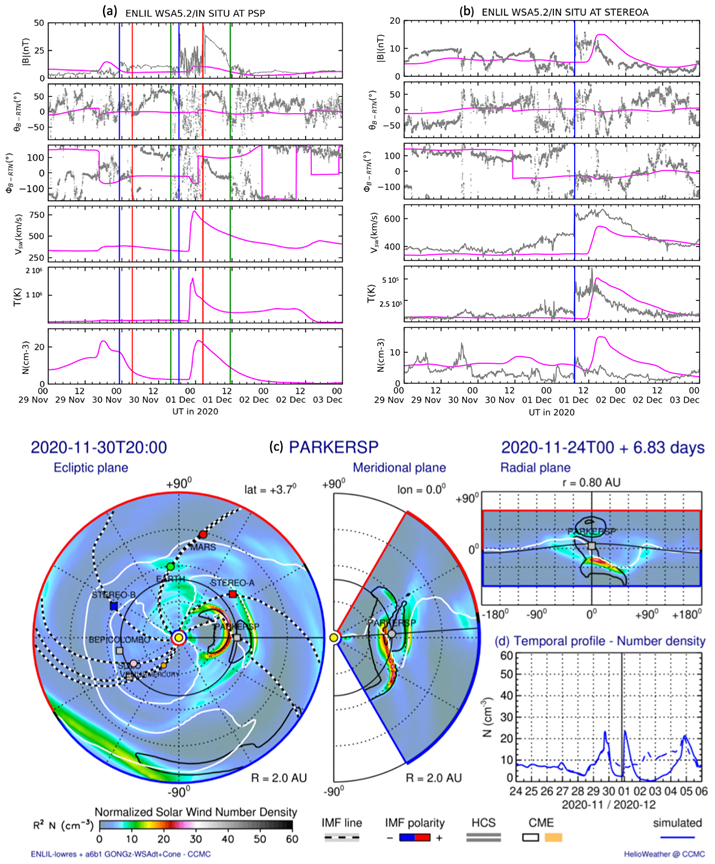
Numerical simulation results. Top: In situ observations at the locations of the PSP (a) and STEREO-A (b), overplotted with the results of the numerical simulation of the CMEs propagation (pink line). Blue vertical lines indicate the IP shock arrival, and red and green lines, respectively, mark the start and end of the magnetic obstacle. Bottom: Snapshot of the density contour plot from the simulation at the arrival of the Interplanetary CME2-driven-shock at the location of the PSP. It shows three different views, the ecliptic plane (left), meridional plane (center), and radial plane (right). The black contours track the ICMEs, as they are set as regions where the density ratio to the background is higher than a certain threshold. The black and white dashed lines represent the IMF lines, and the white lines show the heliospheric current sheet, which divides regions with opposite magnetic polarity, shown in blue (negative) or red (positive) on the outer edge of the simulation area.
Figure 2 shows the result of the numerical simulation of the CMEs (pink line) overplotted on the actual PSP and STEREO-A in-situ data and, at the bottom, the instant of the interaction at the PSP height. At the top, the data includes, magnetic field strength, angular component, solar wind bulk velocity, temperature, and density. The blue vertical lines indicate the transit of the ICMEs front at the spacecraft location and red and green lines, respectively, mark the start and end of the magnetic obstacle. At the bottom, it is shown a snapshot of the density contour plot from the numerical simulation at the arrival of the ICME2-driven-shock at the location of the PSP and lead by the first interplanetary CME1 (ICME1). It shows three different views: the ecliptic plane (left), meridional plane (center), and radial plane (right) of the ICMEs at the location of PSP.
Part of our analysis was to understand and explore the characteristics of this interaction. Yet, there is not a significant amount of research related to the interaction or collision of ICMEs in the inner heliosphere, in part due to the lack of observations of the events that limit the investigations. While there are many physical processes associated with the interaction, such as particle acceleration or plasma heating, the collision among the magnetic obstacles is just the peak of such encounter. In a simplistic view of two magnetized plasmoids colliding, the dynamics of such a hit are basically determined by the kinematic aspects and the internal magnetic structure. Thus, the amount of momentum in each structure plus the orientation and chirality of the structures in the solar wind would determine the consequences of the collision. Both CMEs will therefore coexist and move together as they travel away from the Sun, if there is a low momentum transfer and magnetic configuration such that magnetic reconnection is not allowed (elastic collision). They will slowly merge when such magnetic configuration is in opposite direction and enabling reconnection. A more dramatic scenario is when a fast and energetic CME overtakes a slow CME (cannibalism). The trailing part of the front CME would be completely absorbed by the rear CME.
From our analysis, we determined that CME2 is almost twice as fast as CME1 and, even though the size was not well characterized by the in situ and remote-sensing reconstructions, the chirality and orientation is such that the magnetic field direction of the contact interface is the same and therefore is not conducive to reconnection. We concluded that the transfer of momentum started before the CME–CME interaction, during the ICME1–ICME2 front interaction under an elastic collision. This interaction may accelerate the leading structure and momentarily increase the distance from ICME2. Thus, this may explain the depleted magnetic field strength in the sheath region between the two structures.
In the second part of the paper, we carried out an in-depth investigation of the internal structure of the ICME2. The magnetic field strength asymmetric profile suggested either large distortion or an internal overexpansion due to the internal heating, both effects probably due to the interaction. We reconstructed the structure to evaluate the level of distortion or expansion separately to reproduce such profile and our results indicate that neither distortion nor expansion can explain such configuration separately, but it requires both effects on the structure. This is a very relevant finding as we need to evaluate the dynamics of these structures as they evolve, aspect that determine important Space Weather parameters such us arrival time or strength of the geomagnetic activity.
The study presented was only possible through the joint analyses of observations, models, and techniques in a collaborative campaign-event exercise. In addition to achieve a scientific goal, this investigation aimed to force the debate and concurrence among the co-authors of the paper to probe our understanding of the phenomena as well as to evaluate the limitations in the resources. Our final thought here is that although our field is constantly seeking more data, exploring machine learning techniques, or looking for new ways to visualize our data, the key driving force for advancing our knowledge comes from scientific collaboration, which must always be encouraged and preserved.