During this past October, a team of researchers took part in a “hackathon” organised by the UK Natural Environment Research Council (NERC) to generate data and new ideas to increase diversity in geoscience. This was an extremely hectic, sometimes stressful but fun and illuminating experience which ultimately culminated in a pilot funding bid (which we learned this week has been successful!). Our idea – GeoCoLab – was to develop a website/app which matched researchers with limited access to analytical facilities to labs which were willing to provide analysis.
Who gets to do analytical research and where?
Alongside coding a prototype app, we conducted a survey and received testimony from dozens of researchers on the myriad ways that lack of access to facilities can negatively impact careers. Another important step was to demonstrate quantitatively and more broadly the existence and effects of such inequalities in analytical geoscience. In particular we focused on exploring the extent of parachute science in analytical geoscience – or, in other words, asking who gets to do analytical research and where?
Parachute science refers to science conducted by researchers from another country from that in which they are working, without local involvement. It’s potential negative effects include: concentration of expertise (or perceived expertise) away from the areas or communities which are subject to that expertise; ignorance of or exploitation of important local knowledge; lack of credit to local collaborators who may be instrumental to successful field data collection among other things.
We focused on parachute science as it is relatively easy to explore through quantitative data from published and freely available sources and therefore could be rigorously studied in the timeframe of the hackathon.
In order to do this, we turned to the PetDB database. This is an online open access database of igneous geochemistry data. The big advantage of using this as the starting point for our analysis was that each sample recorded in the database has an associated grid reference. This greatly simplified the job of determining which country an article was about. Determining this information directly from the title or tags of an article would be extremely hard to automate reliably and very slow to do manually.
The technical bit – data extraction
Due to the time constraints of the hackathon, the approach taken to extracting data was very much speed over style. The data for all records in the PetDB database were scraped using a Python script (code here) and the country of the samples determined from the grid reference. The affiliation of both the first author and of the full author list was determined automatically using an R script to string match the addresses to a list of all world countries (code here).
Analysing the data
The final dataset consists of 1426 references for which the affiliation of all authors and country could be determined. We categorised each of these as either Domestic, where the first author affiliation and country of sample origin matched; Foreign with local involvement, where the affiliation of someone other than the first author matched the country the samples were from; or Foreign where none of the authors’ affiliations matched the sample country.
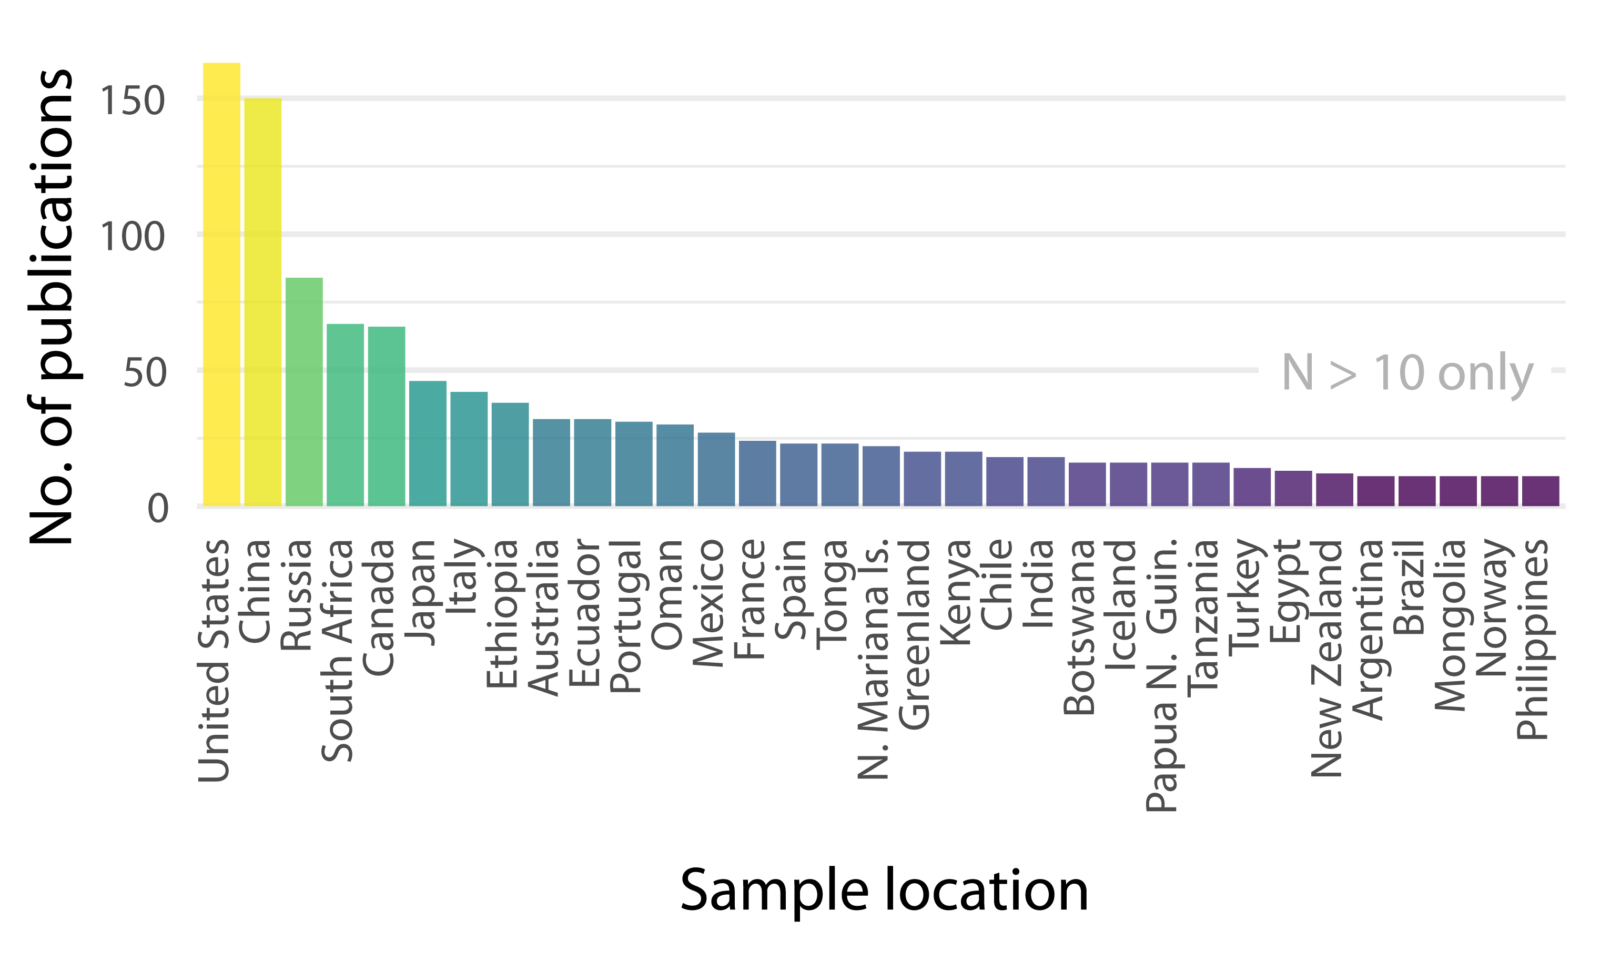
Barchart showing number of samples from each country in the PetDB database (countries with less than 10 samples excluded)
The largest number of publications concern samples from the United States and China (N>100) with Russia, South Africa and Canada (N>50) and Japan, Italy, Ethiopia, Australia, Ecuador, Portugal and Oman all well represented (N>25).
Parachute index
To understand if the extent to which parachute science varies by country, we grouped the data by country of sample origin and for each country calculated the parachute index, defined as the log of the ratio of publications concerning that country which include local researchers to those which include no local researchers (Raja et al., 2021).
Plotting the parachute index by country of sample origin gives us insight into the extent to which countries are subject to parachute science. Negative numbers tend to imply a greater degree of parachute science while positive numbers imply a higher degree of domestic research (i.e. research on samples from a given country by researchers in that country).
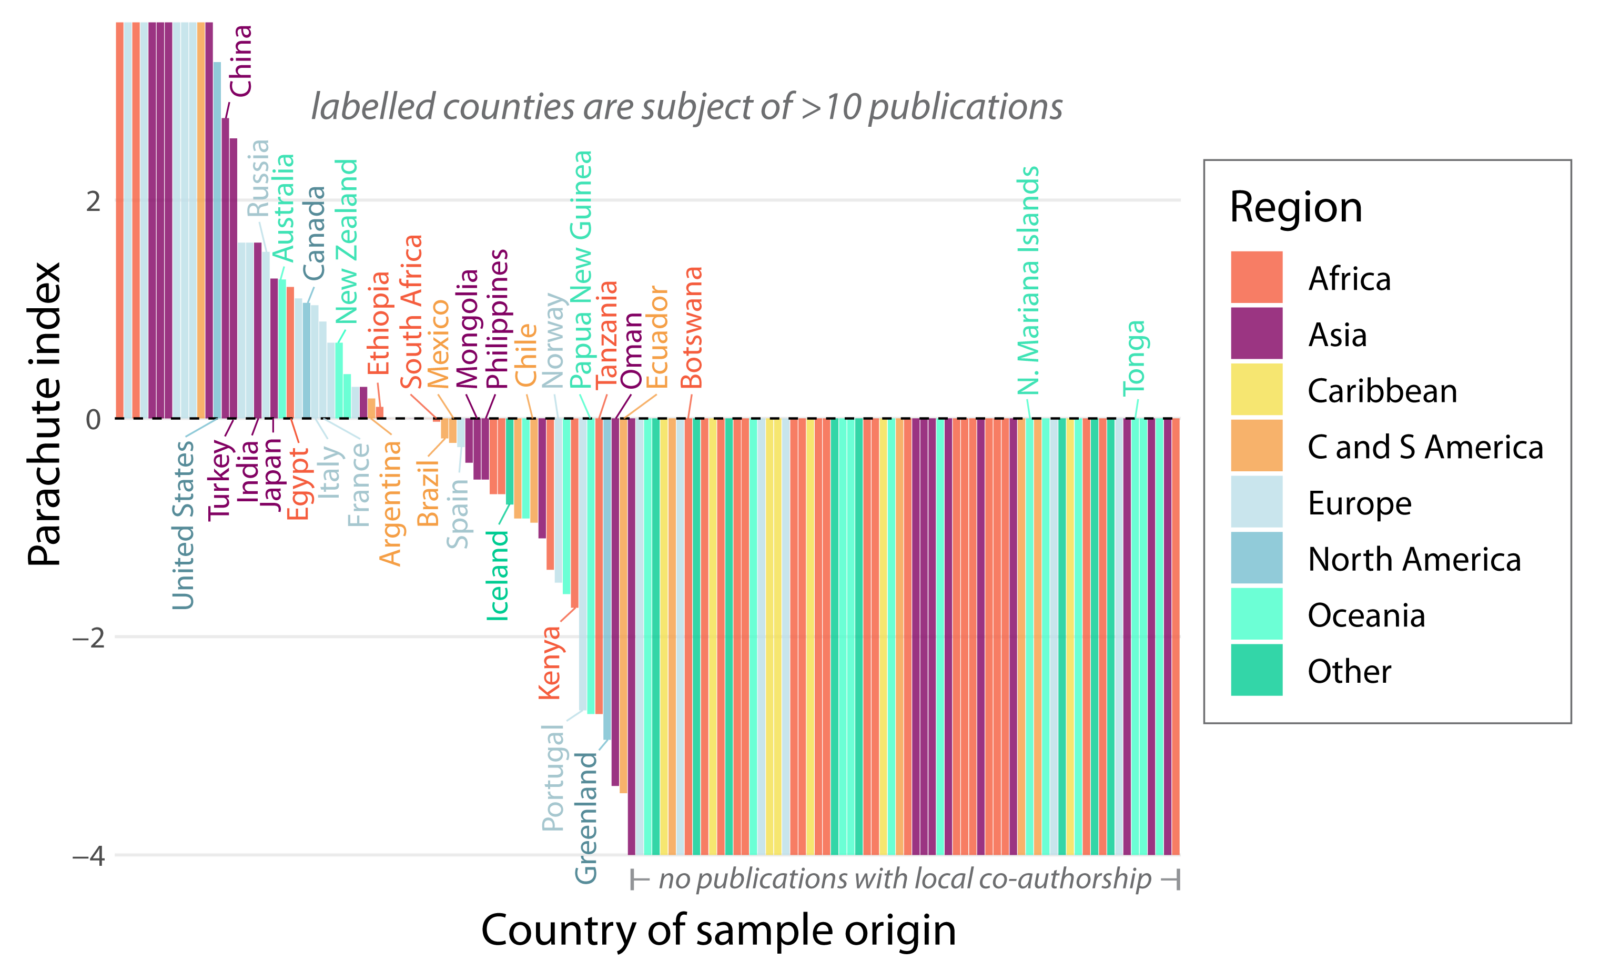
Barchart of parachute index for each country in the PetDB database – labelled countries are subject of more than 10 publications. Parachute index is the log of ratio of publications about a country with include local researchers (either as first or co-author) to those which include no local researchers.
There are two main things clear from this plot. Firstly, notwithstanding a few countries with high positive indices but few total publications at the far left of the plot, the countries with positive indices (showing high rates of local involvement) are dominated by those from Europe, North America and Asia (pale blues and purple) as well as New Zealand and Australia. At the other end of the spectrum on the right hand side of the graph, countries with negative parachute indices (showing high levels of parachute science with no local involvement) tend to be in Africa, Central and South America, the Caribbean and Oceania.
It is particularly notable just how many countries do not have a single publication with a local co-author. In several cases, including Botswana, Tonga and the N Marianas Islands this is despite 10 or more references in the database concerning those countries.
Parachute index by region
Since there are quite a few countries with a small overall number of publications, these tendencies are perhaps more clearly shown by summarising the parachute index data by regions and plotting the results.
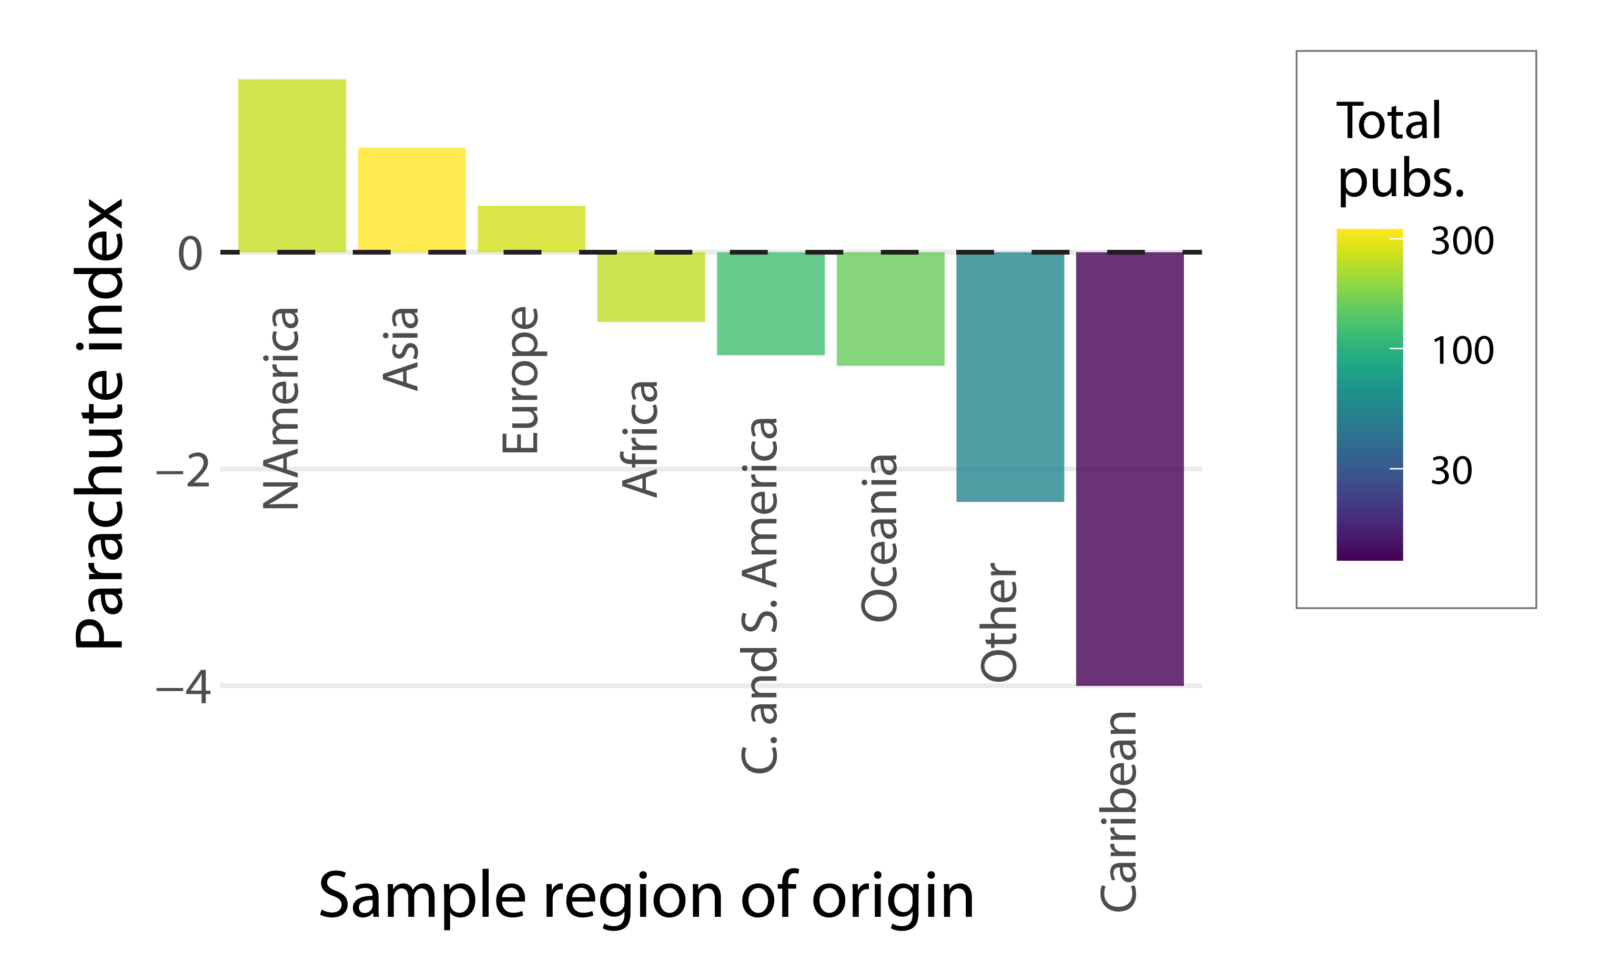
Barchart of parachute index summarised by region
Which countries do the most research in other countries?
It’s also useful to look at the country of the first author. Where are the places doing the most parachute science? (rather than subject to it as the above graphs illustrate)
First we plot a bar chart showing the total publications from each country categorised as domestic, foreign or foreign with local involvement:
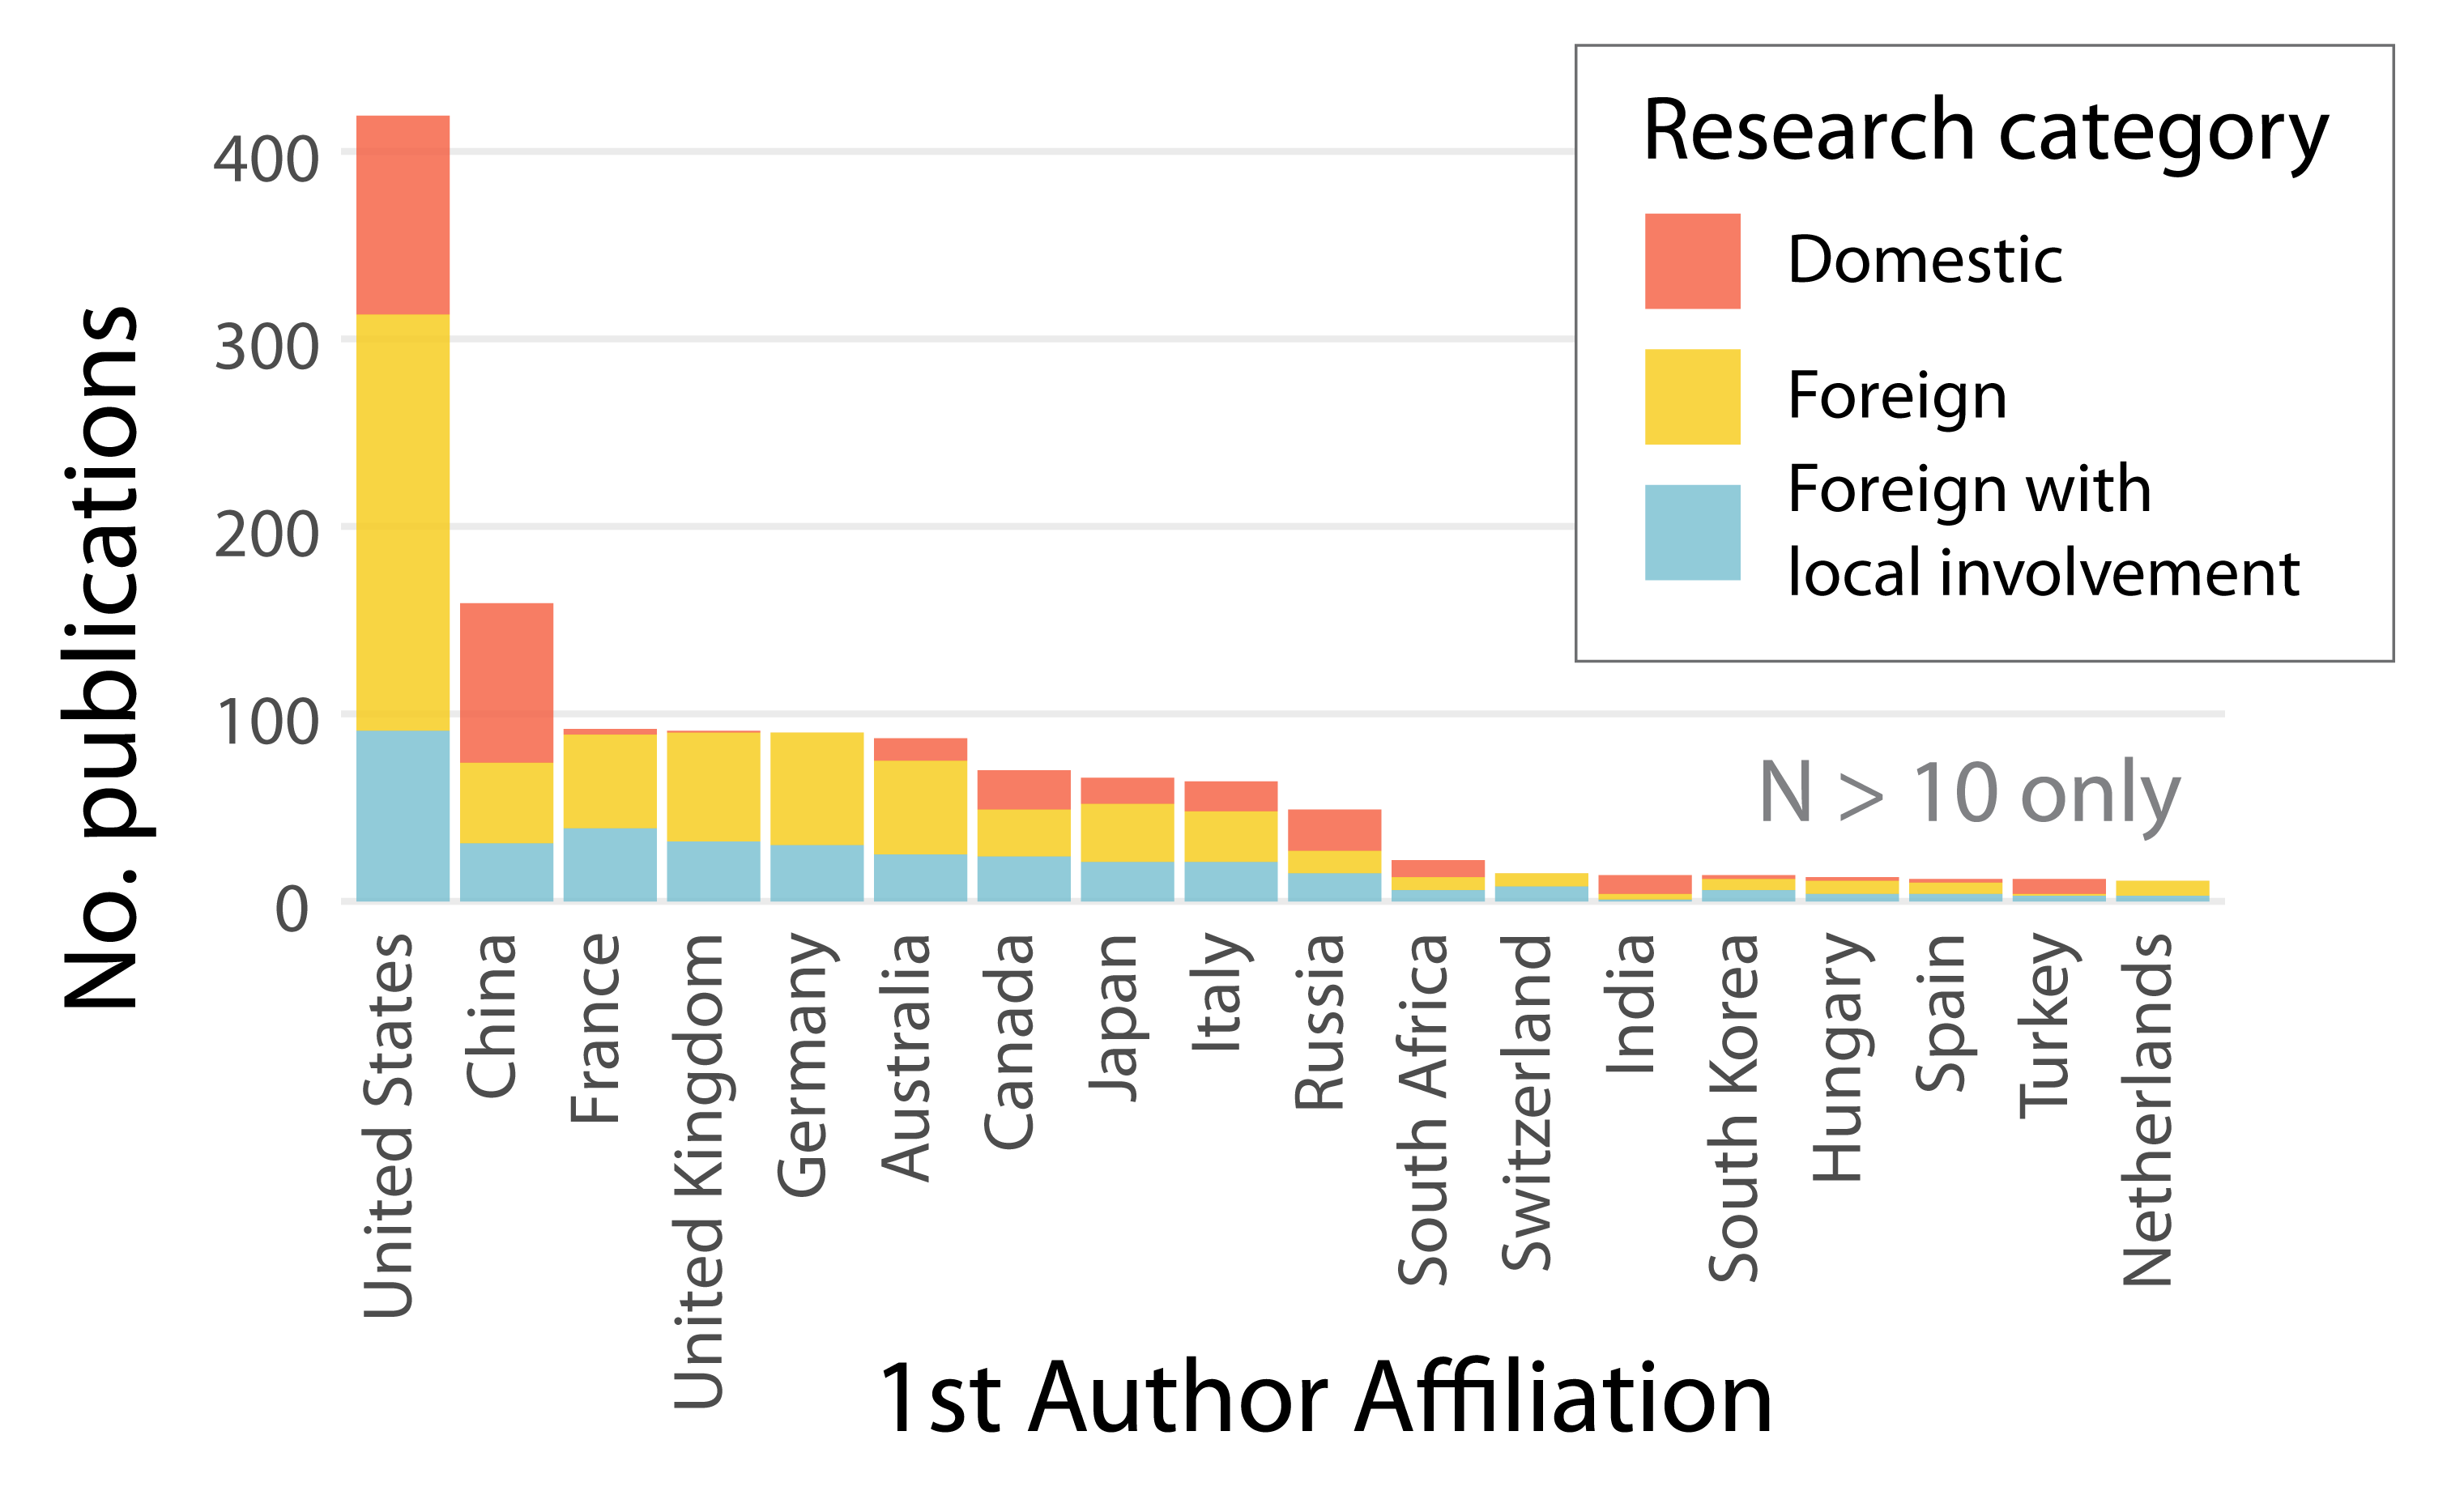
Bar chart of number of publications from each country subdivided by whether research is local, foreign with local involvement or foreign (with no local involvement). Countries with less than ten 1st author publications are excluded for clarity.
Is is clear from this chart that foreign research makes up a significant proportion of the publications for most of the countries with the largest numbers of publications (>50 publications). In particular, we can see that domestic research makes up a tiny proportion of the total output from the UK, France and Germany but that these countries have a large number of 1st authored papers, second only to the USA and China.
The USA and China have a somewhat larger proportion of domestic research and are the best represented in the dataset in terms of number of first authored publications.
To get some more detail on the breakdown of research conducted domestically versus abroad we can plot the proportion of foreign research as a proportion of total publications for each country:
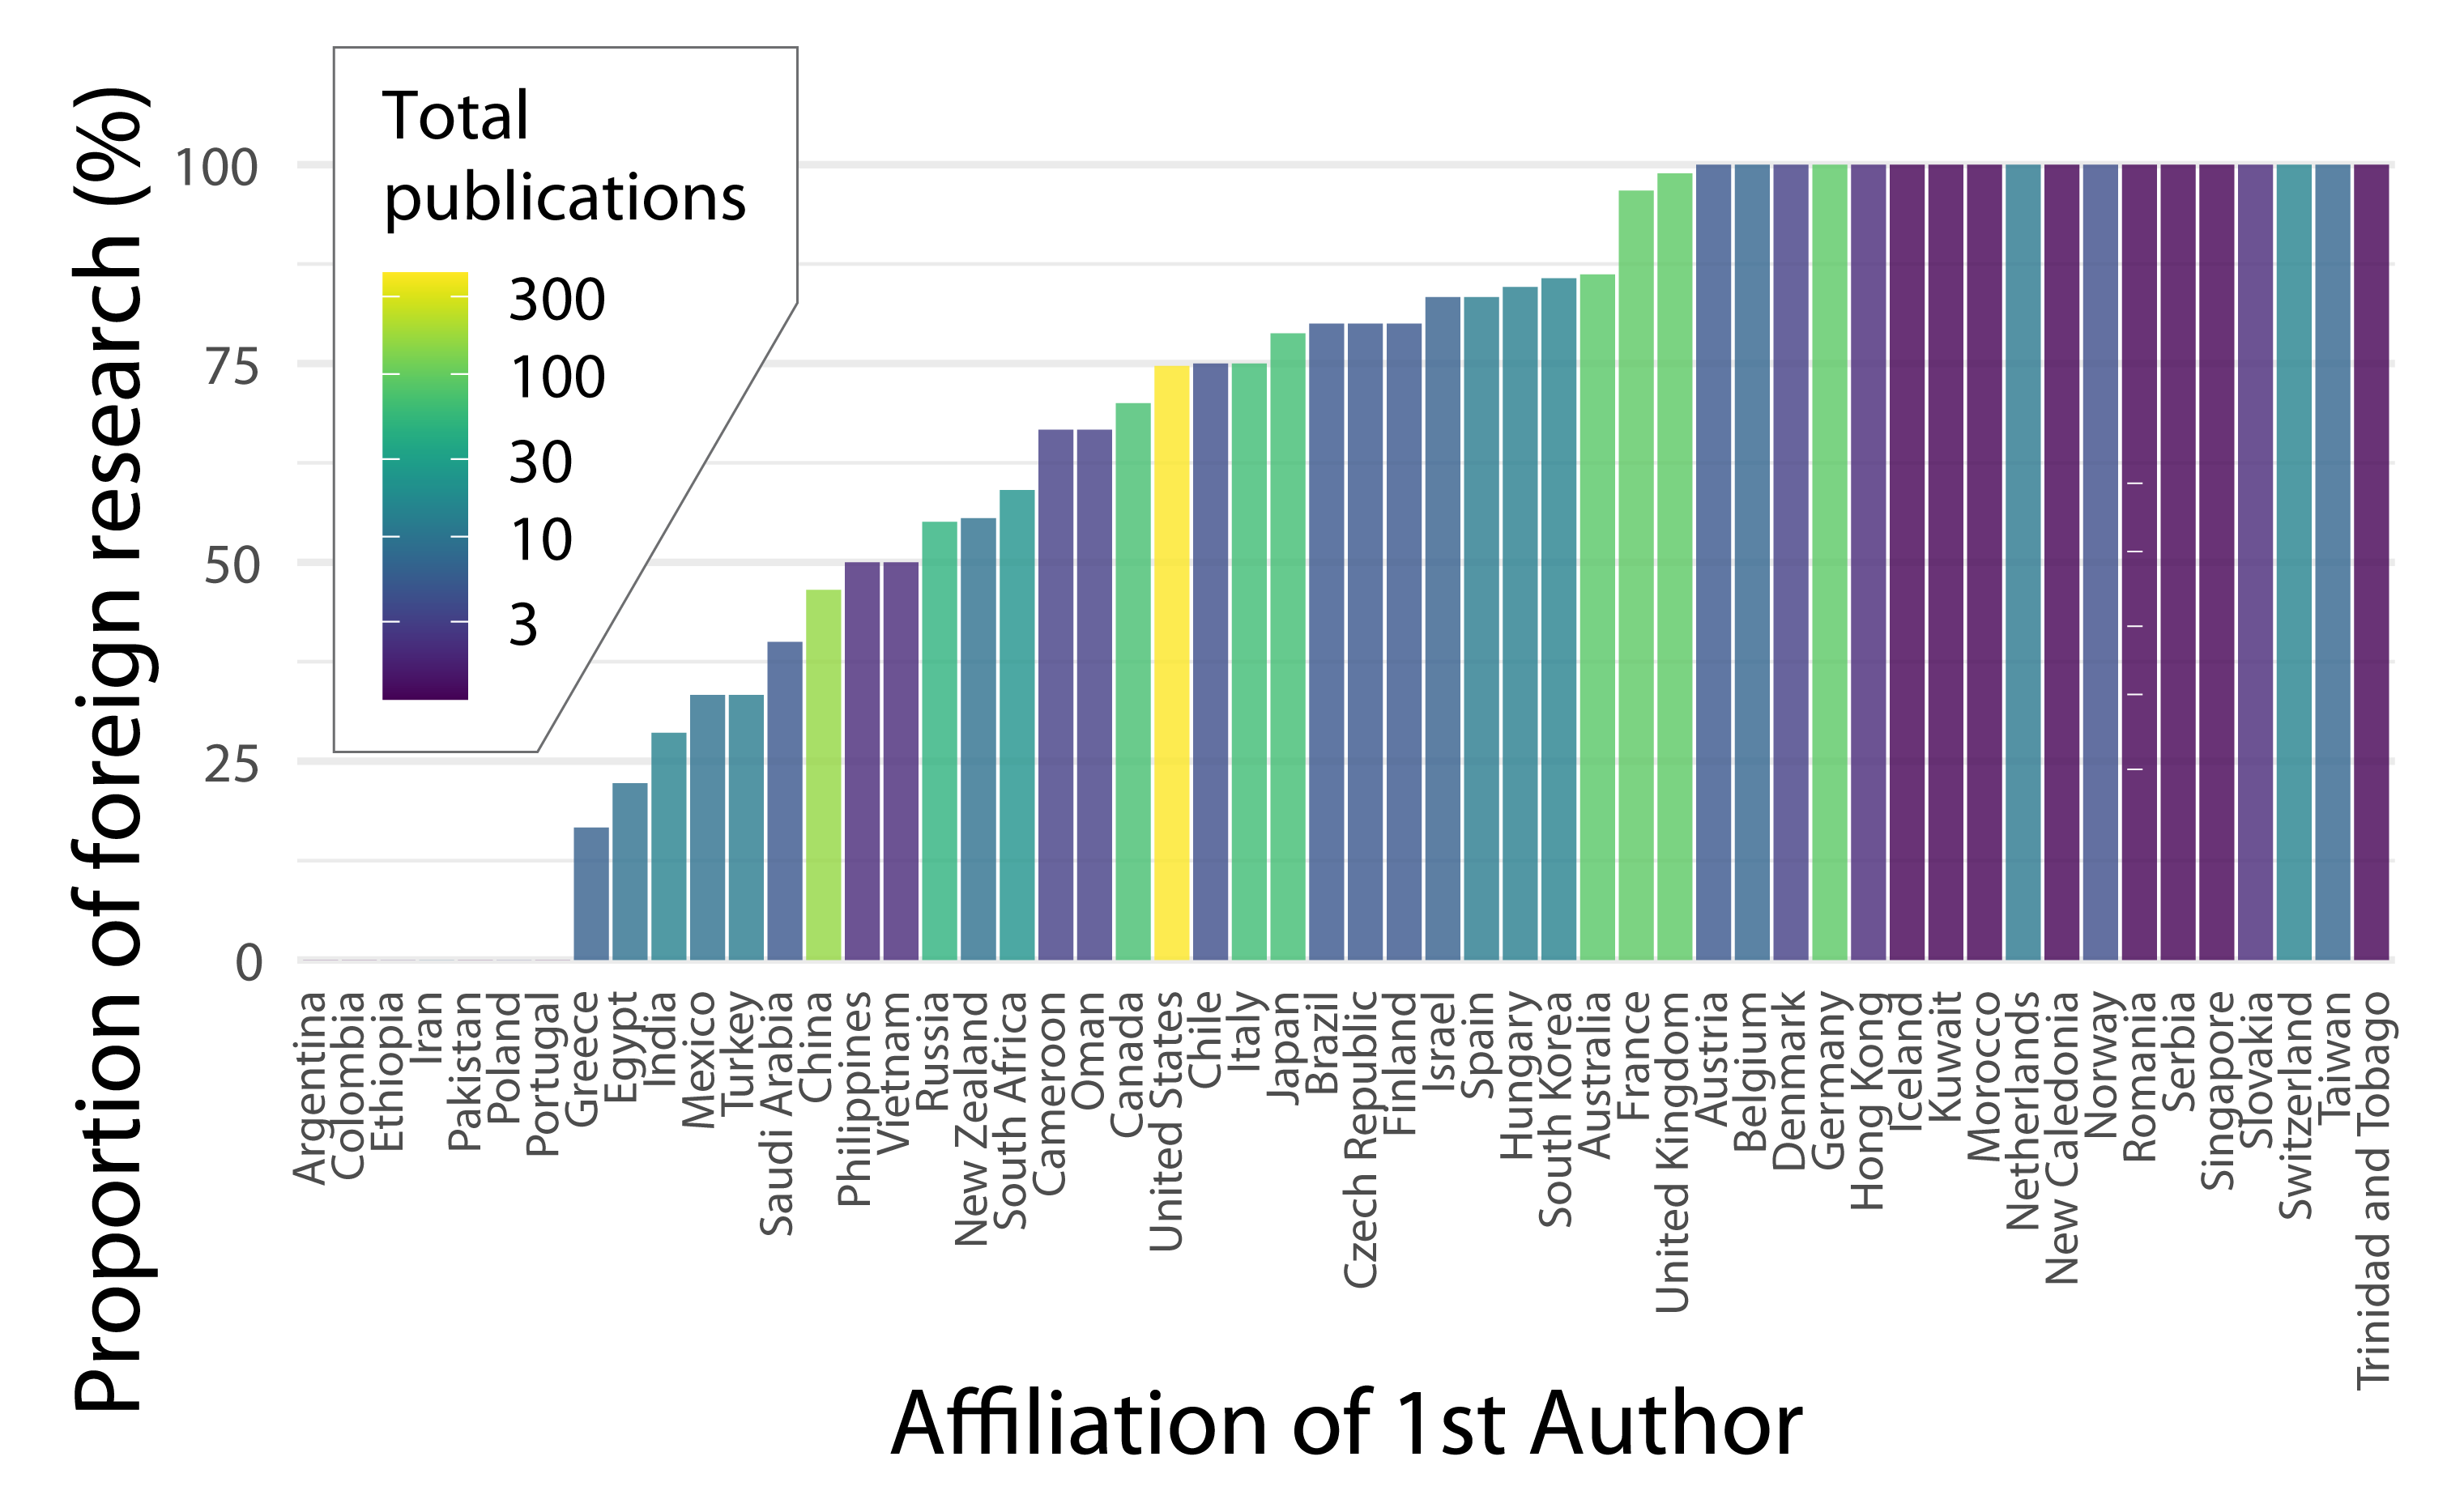
Bar chart showing the proportion of foreign research as a percentage of total publications for each country (excluding countries with no first author publications)
This plot reiterates several of the same features as the previous one. A large proportion of the published outputs from many European countries – including the UK, France and Germany – conduct a large proportion (>75% in most cases) of research abroad.
At the other end of the scale, on the left of the graph, countries with a large proportion of research conducted domestically are more typically in Africa, Asia or South America though Greece and Portugal also feature at this end of the graph.
A number of countries at the right of the graph show 100% of foreign research. Many of these however are represented by only a handful of publications (purple colours) and may not be particularly representative.
Lastly we can look at the proportion of foreign research which includes local collaborators:

Bar chart of the proportion of foreign research with local collaborators as a percentage of total foreign research publications for each country (excluding those with no foreign research publications)
Of countries with a large number of publications based on foreign research (green and yellow colours), the USA, Australia, Germany, United Kingdom show the lowest apparent engagement with local researchers with <30% of publications including a local collaborator. Japan, China, Italy, France, South Africa and Canada are only slightly better with 30-50% of publications featuring a local co-author.
Parachute science in analytical geoscience
Altogether these results show strong evidence that parachute science is a phenomenon in analytical geoscience. Though the patterns are not universal the data indicate that the countries undertaking such research are generally richer and include large numbers of European and North American countries. Meanwhile the countries most subject to parachute science tend to be in Central and South America, Africa, the Caribbean and small island nations in Oceania and elsewhere. Furthermore, these regions typically have fewer, or in many cases no, first authored publications despite being well-represented as the subjects of research. This in particular lends support to the argument that gaps in access to analytical facilities may have a direct impact on the research productivity and careers of researchers in many countries.
Looking forward – the GeoCoLab project
With the good news that the project has been funded by NERC, we are looking forward to working to address some of the inequalities that are apparent in access to facilities. Over the coming months we will be working to develop a fully functioning matching app for labs and researchers as well as building upon the preliminary analysis of parachute science and inequities in access to date.
If you run a laboratory or analytical facility and would be interested in partnering with the project, we would particularly like to hear from you. Get in touch at GeoCoLab.App@gmail.com. We’d also love to hear about individual experiences via our survey on the impacts of analytical access (or lack thereof) on research careers which is still open for responses here. To stay up to date with what we’re up to as the project develops, follow us @GeoCoLab on Twitter or check our website https://geocolab.github.io/ for updates!
![]()
The GeoCoLab Team is:
Dr Rebecca Williams, University of Hull @Volcanologist
Dr Munira Raji @TheDroneLady
Dr Clare Bond, University of Aberdeen @DrCEBond
Ginger Butcher, Natural History Museum @assortedginger
Dr Elliot Carter, Trinity College Dublin @elliotjcarter
Edd Lewis, British Geological Survey @KoalaGeo
Dr Sian Davies-Vollum, University of Derby @SianDV
Dr Brian Thomas, Newcastle University @BFThomas_Water
An earlier version of this blog was originally published at https://geocolab.github.io/blog/blog2/
Laura Schnee
Dear Elliot and GeoCoLab Team! What a wonderful and incredibly relevant undertaking! I do wonder though, how this piece of insightful research would be citable so it can be used as a lever to facilitate change in the geosciences? Thank you so much in advance! Best regards and Cheers, Laura
Elliot Carter
Hi Laura, thanks for your comment! It’s lovely to hear positive feedback like this. We are currently working to extend on the preliminary analysis described in this blog and the hope is to publish that as an open access journal article in the future. I think it’ll be very likely that we’ll make it available as a preprint so hopefully there will be something citable within the year. Probably the best place to follow for updates would be Twitter @GeoCoLab. Cheers, Elliot