Words on Wednesday aims at promoting interesting/fun/exciting publications on topics related to Energy, Resources and the Environment. If you would like to be featured on WoW, please send us a link of the paper, or your own post, at ERE.Matters@gmail.com.
***
Asadieh, B. and Krakauer, N. Y.: Global trends in extreme precipitation: climate models versus observations, Hydrol. Earth Syst. Sci., 19, 877-891, doi:10.5194/hess-19-877-2015, 2015
Abstract:
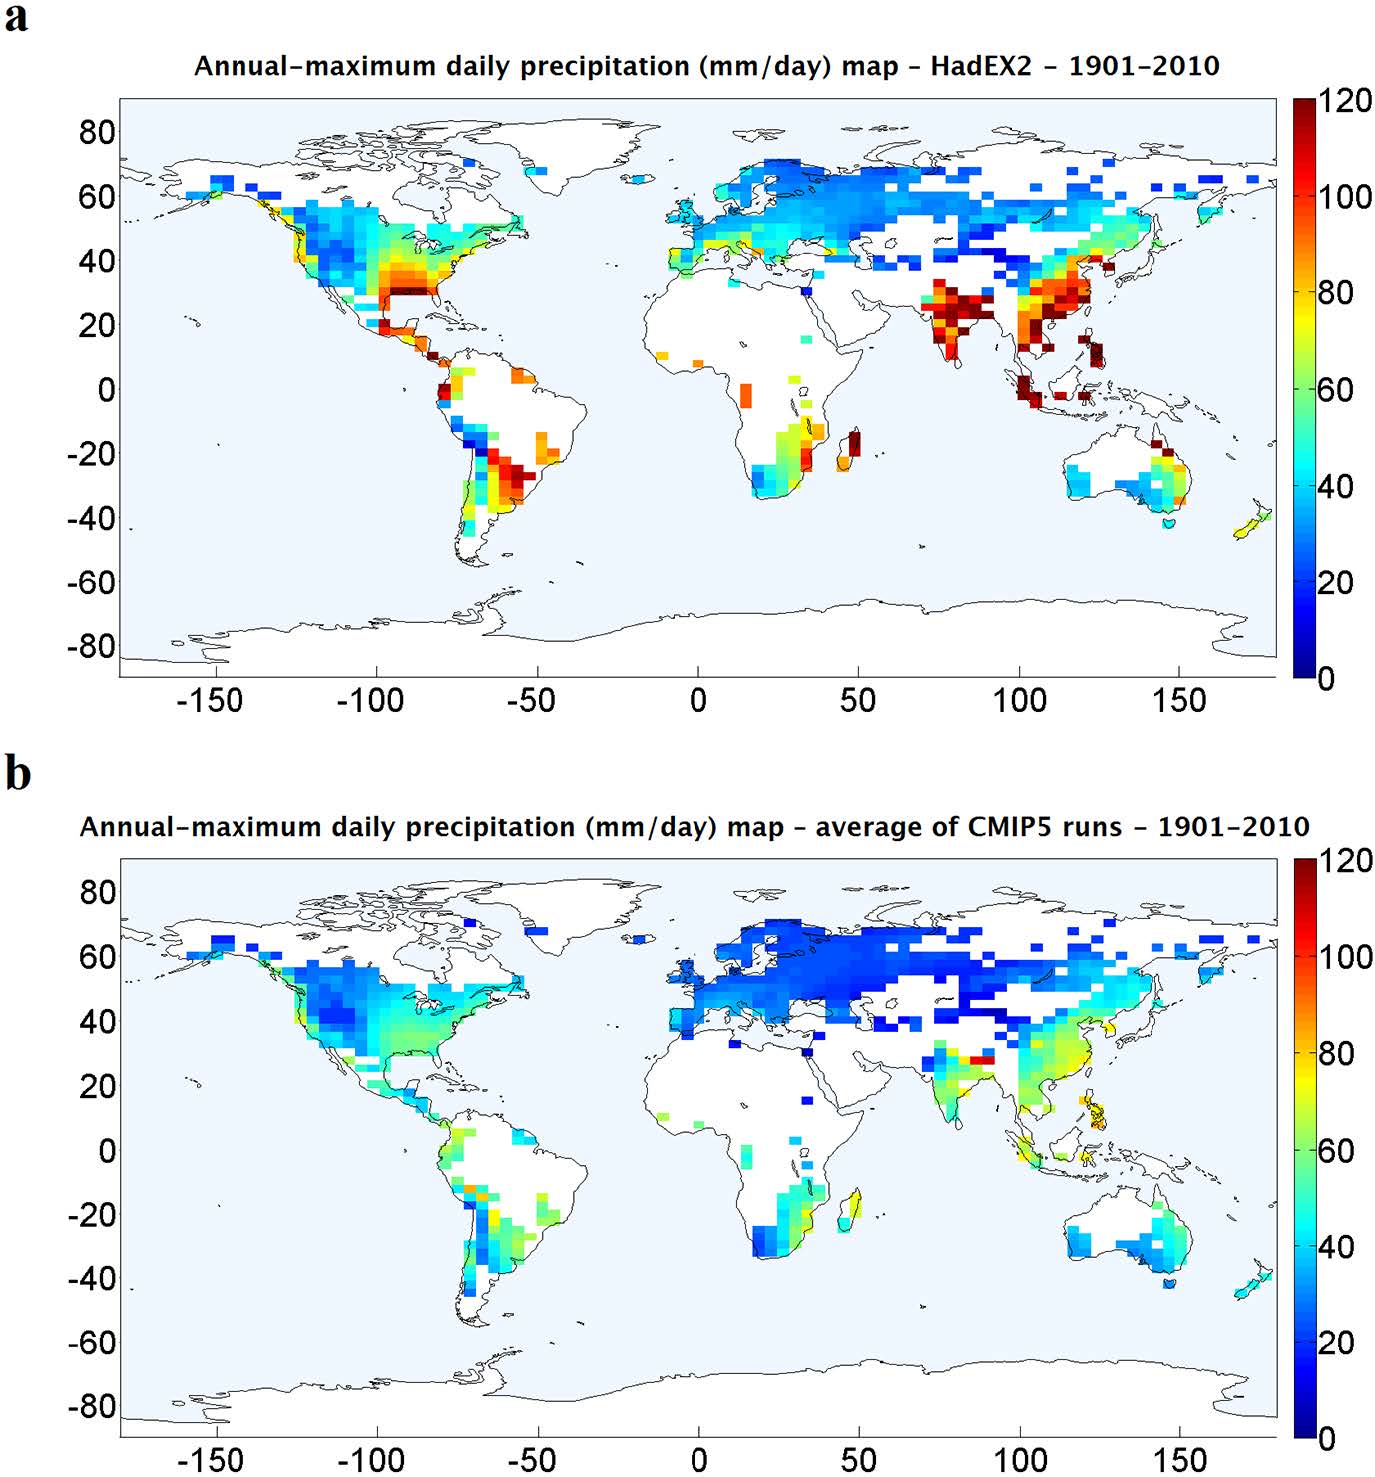
Precipitation events are expected to become substantially more intense under global warming, but few global comparisons of observations and climate model simulations are available to constrain predictions of future changes in precipitation extremes. We present a systematic global-scale comparison of changes in historical (1901–2010) annual-maximum daily precipitation between station observations (compiled in HadEX2) and the suite of global climate models contributing to the fifth phase of the Coupled Model Intercomparison Project (CMIP5). We use both parametric and non-parametric methods to quantify the strength of trends in extreme precipitation in observations and models, taking care to sample them spatially and temporally in comparable ways. We find that both observations and models show generally increasing trends in extreme precipitation since 1901, with the largest changes in the deep tropics. Annual-maximum daily precipitation (Rx1day) has increased faster in the observations than in most of the CMIP5 models. On a global scale, the observational annual-maximum daily precipitation has increased by an average of 5.73 mm over the last 110 years, or 8.5% in relative terms. This corresponds to an increase of 10% K−1 in global warming since 1901, which is larger than the average of climate models, with 8.3% K−1. The average rate of increase in extreme precipitation per K of warming in both models and observations is higher than the rate of increase in atmospheric water vapor content per K of warming expected from the Clausius–Clapeyron equation. We expect our findings to help inform assessments of precipitation-related hazards such as flooding, droughts and storms.

