Congratulations for being awarded this years Early Career Scientist Award of the ERE division! Can you tell us a bit about yourself (not only about your work life)?
Thank you so much! I am delighted to receive this award and grateful to the European Geosciences Union for this recognition.
I am an engineer and a geoscientist with a passion for understanding the Earth’s subsurface processes and their implications for developing clean energy resources and sustainability. I generate knowledge, workflows and tools to safely and efficiently unlock the huge potential of the subsurface to cut carbon emissions and produce low-carbon and sustainable energy in the fight against the climate change crisis. To this end, I conduct interdisciplinary research combining concepts from geomechanics, geochemistry, seismology, data science and artificial intelligence through a combination of experimental, numerical and data-driven approaches.
I earned my PhD in Petroleum Engineering in late 2018 from Tehran Polytechnic, Tehran, Iran. After a short period in the industry and as a lecturer at the Chamran University of Ahvaz, Ahvaz, Iran, I started my postdoc research career in Jan. 2020 at the Spanish National Research Council (IDAEA-CSIC), Barcelona, Spain. I initially enrolled as a contracted postdoc in the ERC-StG project GEoREST and then as “Juan de la Cierva Incorporación” and “PCI-MSCA IF-ST 2020” (project EASY GEOCARBON) fellows. Awarded a Horizon Europe Marie Curie fellowship for the project THMC4CCS, in 2023, I joined the Subsurface CO2 Research Group at Imperial College London, London, UK, where I am currently conducting my research. I have had this opportunity to be part of two amazing research groups during my postdoc and collaborate with leading scientists in my field, significantly assisting me in shaping my academic career. I am grateful for their support.
Beyond my scientific work, I spend my time with my family; my wife Atefeh and my little daugther Rose. I enjoy being outdoors, hiking and cycling. I love exploring many parks and green spaces in London. Besides, I love cooking and gardening. They keep me energized and help me release daily tensions.
Iman Rahimzadeh Kivi, the ERE division Outstanding ECS Awardee 2025.
How did you get into your research topic? Did you know from the very start of your career that this is what you want to research?
My interest in investigating multiphysics processes relevant to subsurface energy and resources management began early during my undergraduate studies, as I was fascinated by the complexity and interdisciplinary nature of processes in the Earth’s crust. However, my path to my current research was shaped by my academic experiences and collaborations.
During my master’s and PhD research, I developed a strong interest in the geomechanics of subsurface applications with a focus on hydrocarbon reservoirs. Later, during my postdoctoral career, I focused my research on addressing challenges in low-carbon geoenergy applications, in particular, carbon capture and storage and geothermal energy developments in light of the underlying multiphysics processes. I wouldn’t say I knew after my PhD that this would be my exact research topic but I was interested in shifting my research toward low-carbon geoenergies. My mentors—Prof. Victor Vilarrasa at CSIC, Spain, and Prof. Sam Krevor at Imperial College London, UK—along with insights from my collaborators, helped me identify key research priorities in these fields. As I delved deeper into the challenges and recognized their critical role in tackling climate and energy issues, my commitment to this path grew stronger. The more I explored, the more certain I became that this was the right direction for my work. I am honored to have been awarded three postdoctoral fellowships, which have allowed me to further expand my research on geologic carbon storage.
What do you see as the big open research questions in your field?
There are several exciting and pressing research questions in my field. One of the major challenges is improving the performance of coupled multiphysics modeling approaches to enable their effective, (near) real-time integration with subsurface monitoring techniques. Such an integration is crucial for efficient characterization of the subsurface to significantly reduce uncertainties, support operational decision-making and mitigate risks associated with developing low-carbon geoenergies. Addressing this challenge requires a combination of emerging technologies, such as machine learning and advanced computational techniques and can only be achieved through interdisciplinary collaboration.
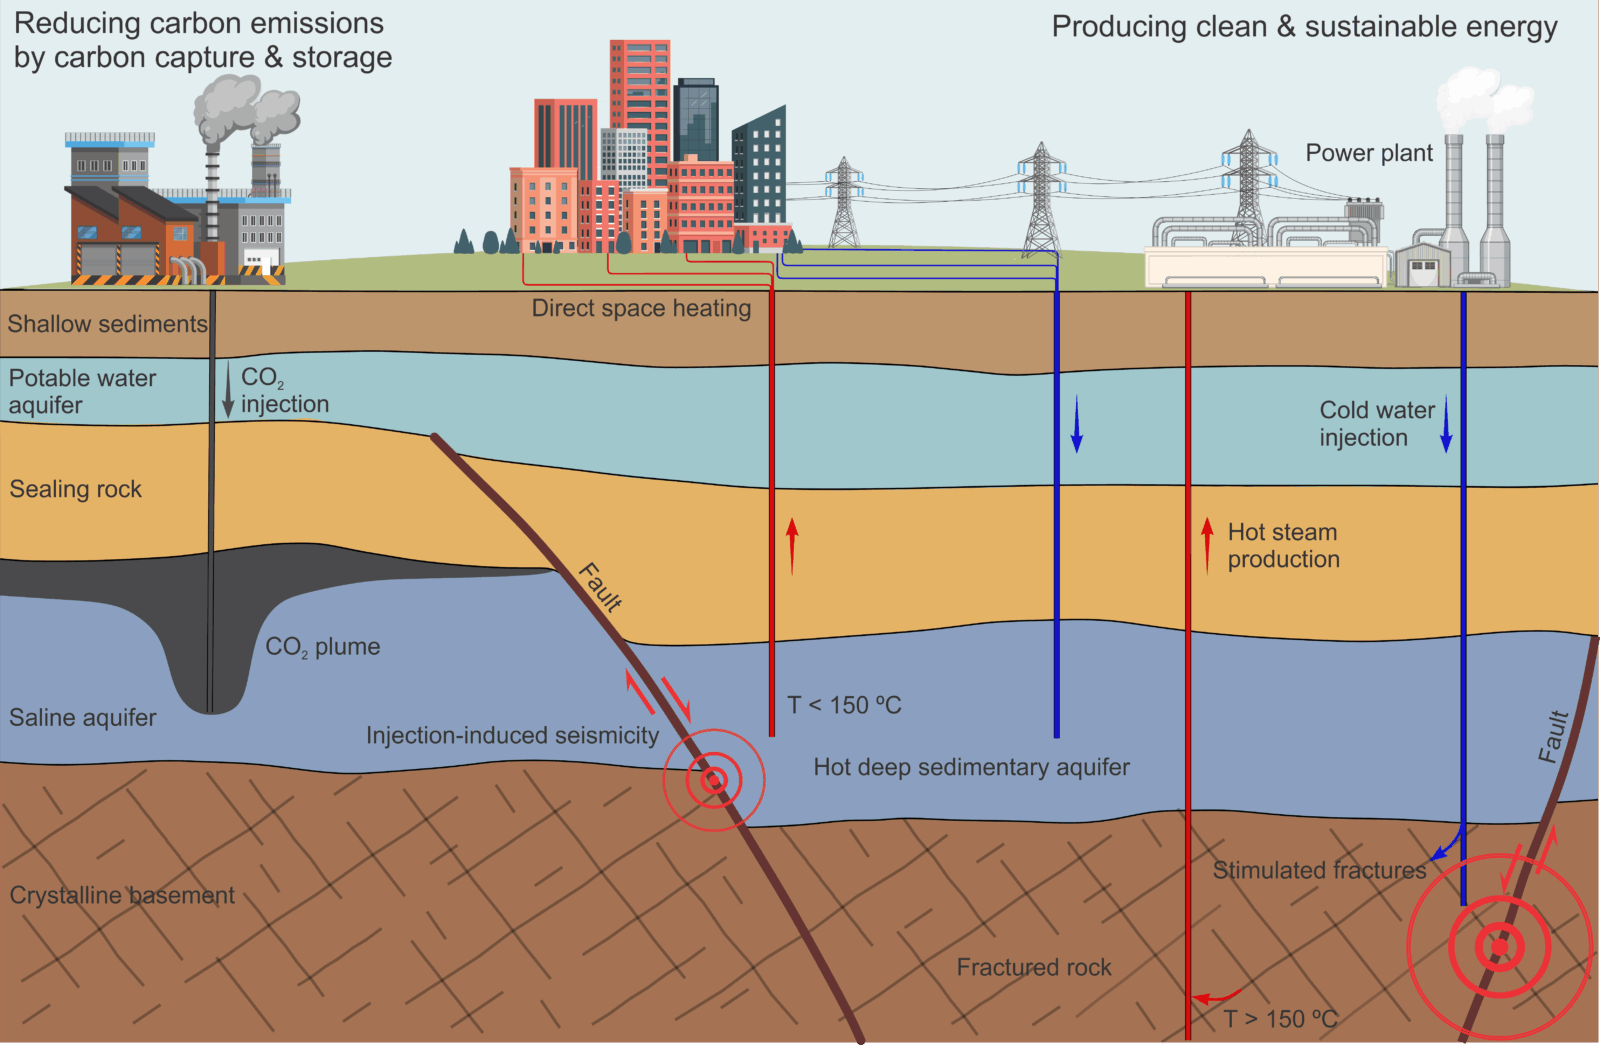
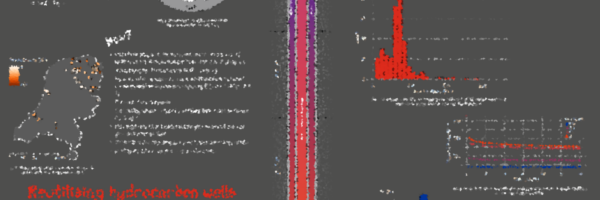
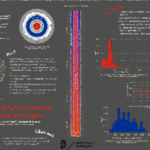
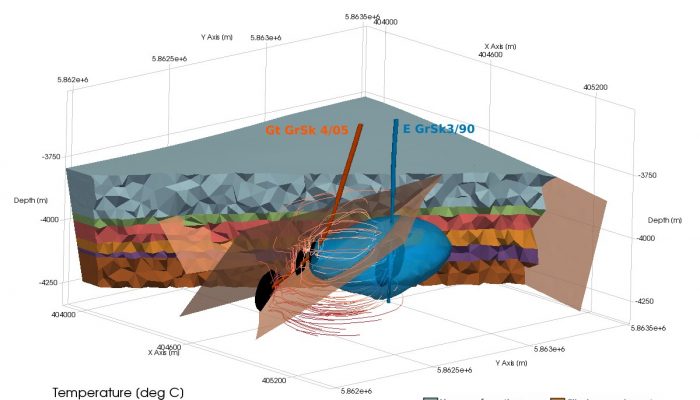
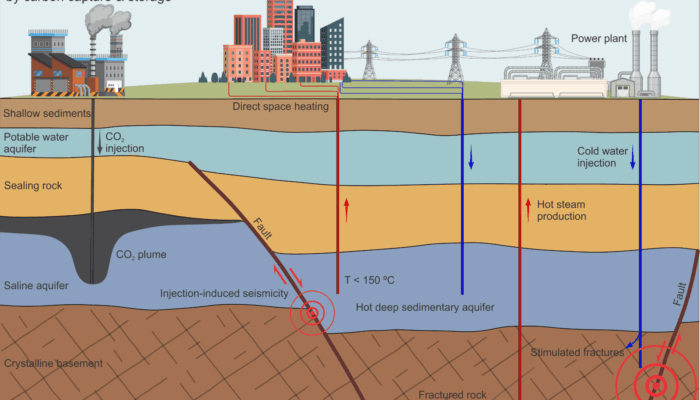
Iman’s research in one image: Subsurface utilisation in the energy transition and related seismicity risks.
What is one of the defining memories from your time as an early career scientist?
One of the defining moments as an early career scientist was receiving the Marie Curie Fellowship. The award was especially important to me because it came after an unsuccessful trial in the previous call. I carefully analyzed the feedback from the evaluators, refined my proposal and the proposed methodology and improved my competence in the short time remaining to the next call. The next year, my hard work paid off, and I got the fellowship.
In addition to the recognition, the fellowship opened up new opportunities for collaboration and significantly expanded my knowledge and expertise in flow and transport phenomena relevant to geologic carbon storage. During this fellowship, I got the chance to develop cutting-edge laboratory techniques for improved understanding of reactive transport phenomena in the subsurface. It has set the ground for my future research on addressing challenges of the scaleup of carbon capture and storage technologies. This experience taught me a lot about resilience, continuous learning, and improvement based on feedback—skills that have helped me shape my scientific career.
If you could give three tips to young scientists, what would they be?
- Science evolves fast. Stay tuned, adapt to new technologies and welcome new ideas.
- Expand your professional network. Establishing international collaborations, participation in conferences and engagement in scientific discussions will reinforce your ability to conduct interdisciplinary research and open new opportunities.
- Be patient in confronting challenges. Research is to address questions that have remained unresolved. This is obviously a challenging process and setbacks are part of that. Learn from failures and keep trying and improving to finally achieve your academic goals.