Words on Wednesday aims at promoting interesting/fun/exciting publications on topics related to Energy, Resources and the Environment. If you would like to be featured on WoW, please send us a link of the paper, or your own post, at ERE.Matters@gmail.com.
***
Yin, Y., Tang, Q., and Liu, X.: A multi-model analysis of change in potential yield of major crops in China under climate change, Earth Syst. Dynam., 6, 45-59, doi:10.5194/esd-6-45-2015, 2015
Abstract:
Climate change may affect crop growth and yield, which consequently casts a shadow of doubt over China’s food self-sufficiency efforts. In this study, we used the projections derived from four global gridded crop models (GGCropMs) to assess the effects of future climate change on the yields of the major crops (i.e., maize, rice, soybean and wheat) in China. The GGCropMs were forced with the bias-corrected climate data from five global climate models (GCMs) under Representative Concentration Pathway (RCP) 8.5, which were made available through the Inter-Sectoral Impact Model Intercomparison Project (ISI-MIP). The results show that the potential yields of the crops would decrease in the 21st century without carbon dioxide (CO2) fertilization effect. With the CO2 effect, the potential yields of rice and soybean would increase, while the potential yields of maize and wheat would decrease. The uncertainty in yields resulting from the GGCropMs is larger than the uncertainty derived from GCMs in the greater part of China. Climate change may benefit rice and soybean yields in high-altitude and cold regions which are not in the current main agricultural area. However, the potential yields of maize, soybean and wheat may decrease in the major food production area. Development of new agronomic management strategies may be useful for coping with climate change in the areas with a high risk of yield reduction.
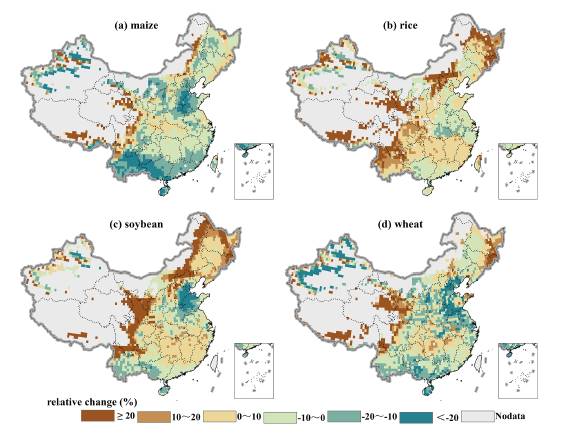
The MM of the relative change in the simulated yield of maize (a), rice (b), soybean (c) and wheat (d) with the CO2 effect at the end of the 21st century (2070–2099) compared with the simulated yield in the historical period (1981–2010).