CR
Cryospheric Sciences

Velocity measurements

Image of the Week – Antarctica’s Flowing Ice, Year by Year

Image of the Week –  Antarctica’s Flowing Ice, Year by Year

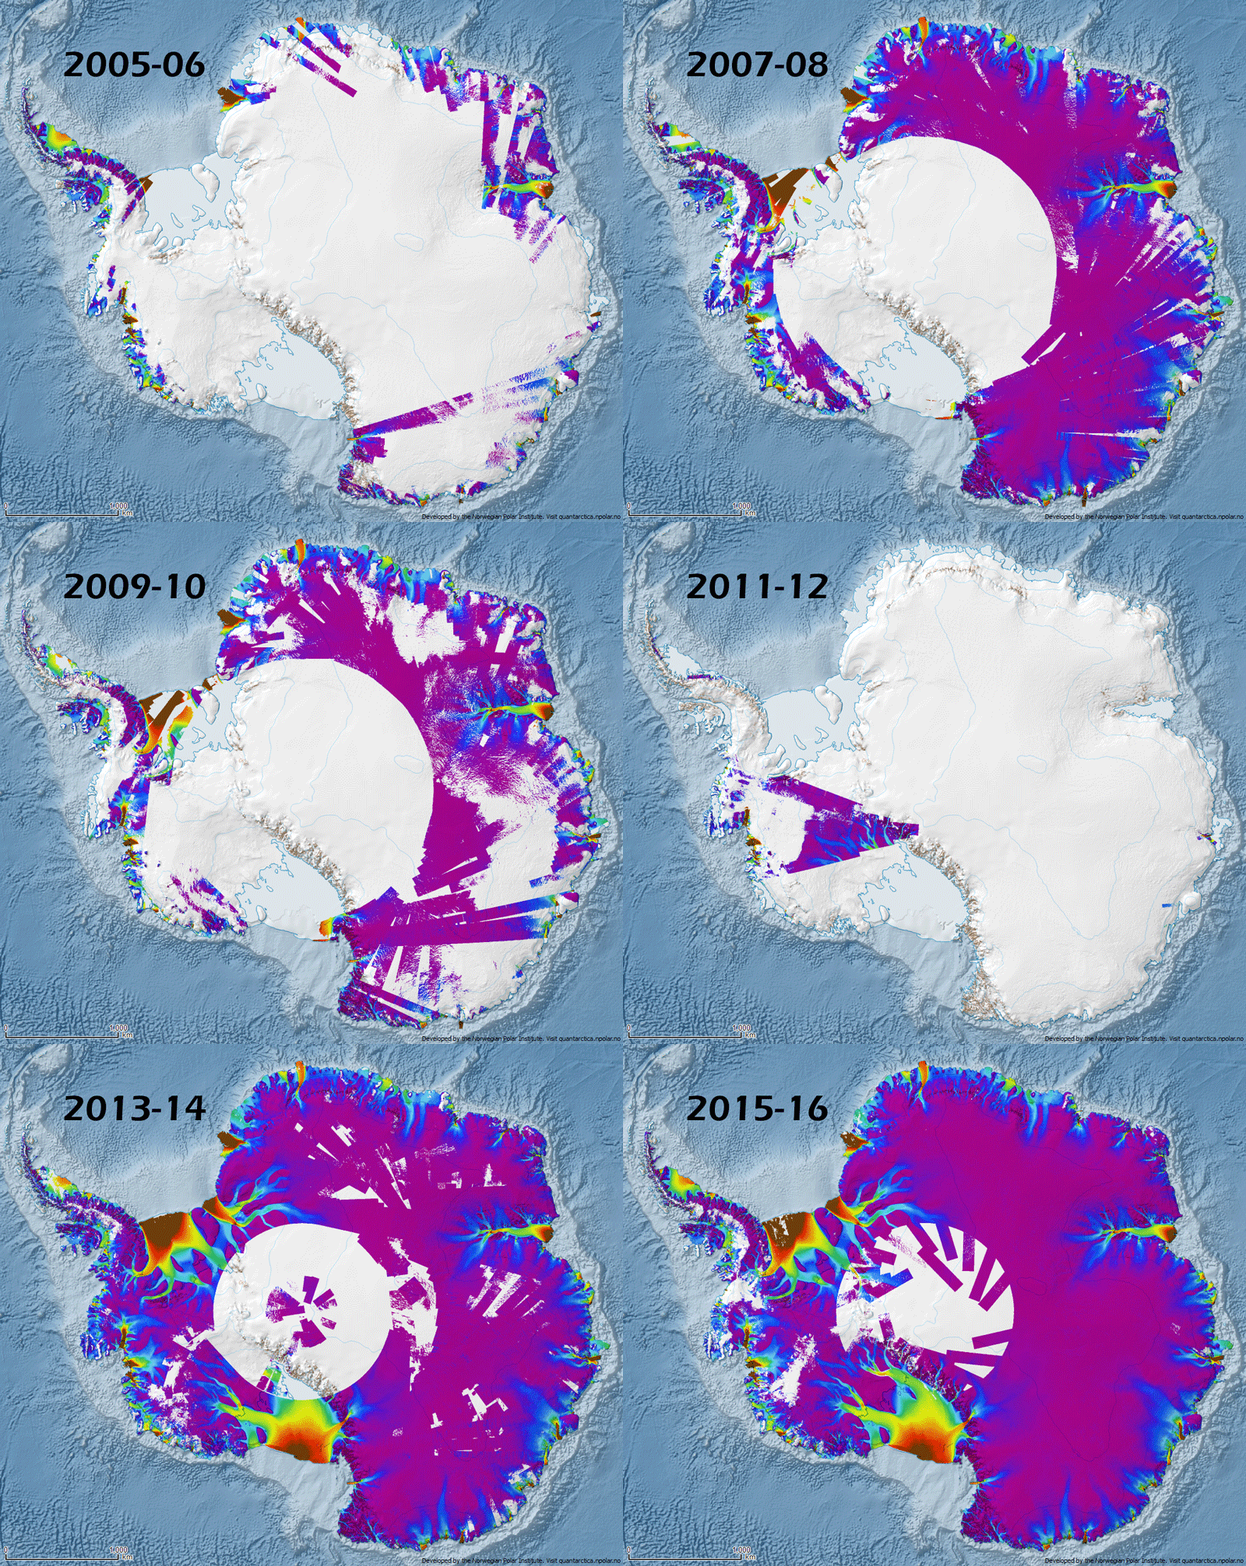
Today’s Image of the Week shows annual ice flow velocity mosaics at 1km resolution from 2005 to 2016 for the Antarctic ice sheet. These mosaics, along with similar data for Greenland (see Fig.2), were published by Mouginot et al, (2017) last month as part of NASA’s MEaSUREs (Making Earth System Data Records for Use in …[Read More]

Image of the Week – How ocean tides affect ice flow

Image of the Week – How ocean tides affect ice flow

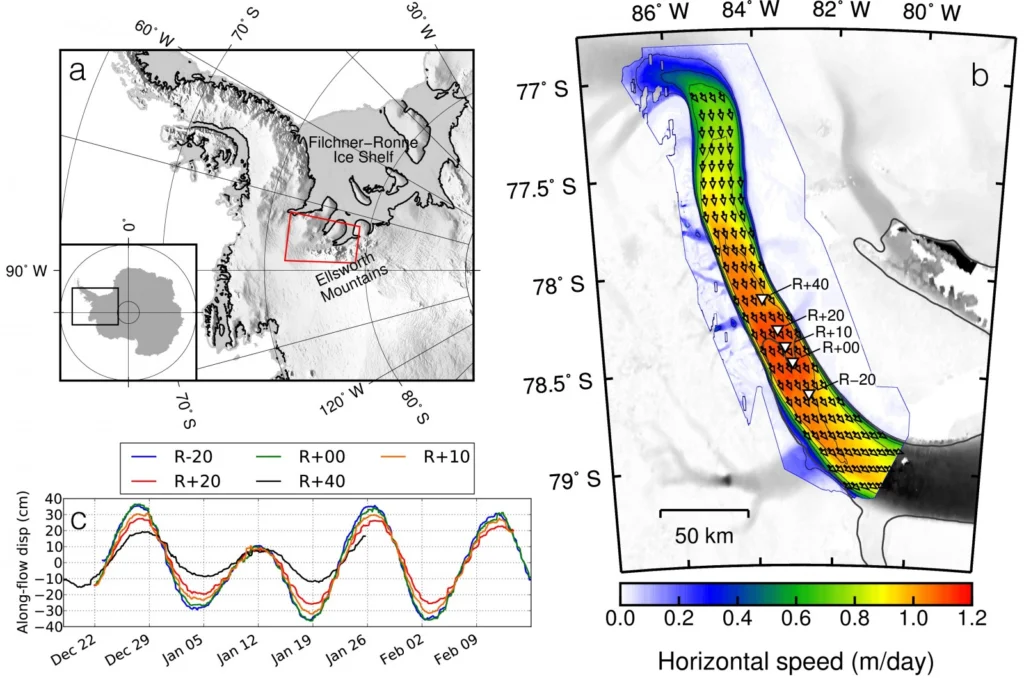
Ice streams discharge approximately 90% of the Antarctic ice onto ice shelves , and ultimately into the sea into the sea (Bamber et al., 2000; Rignot et al., 2011). Whilst flow-speed changes on annual timescales are frequently discussed, we consider here what happens on much shorter timescales! Previous studies have shown that ice streams can respond …[Read More]

Image of the Week – Antarctic fieldwork 50 years ago!

Image of the Week – Antarctic fieldwork 50 years ago!

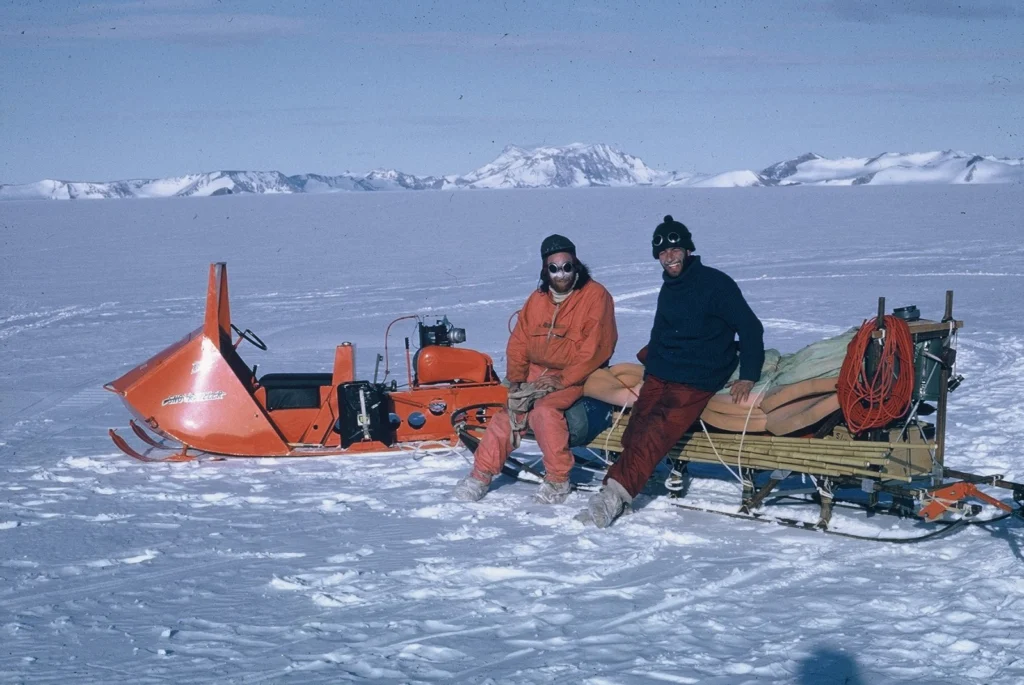
So far this blog has published many pictures of current polar field work campaigns. Today, we would like to take you back to Antarctic expeditions during the 1960s. The photos presented in this post date back from the Belgian-Dutch Antarctic field campaigns of 1964-1966. The first picture shows Ken Blaiklock (red overalls) with a Belgian surveyor. …[Read More]