The Forum for Research into Ice Shelf Processes, aka FRISP, is an international meeting bringing together glaciologists and oceanographers. There are no parallel sessions; everyone attends everyone else’s talk and comment on their results, and the numerous breaks and long dinners encourage new and interdisciplinary collaborations. In fact, each year, a few presentations are the result of a previou ...[Read More]
Image of the Week — FRISP 2016
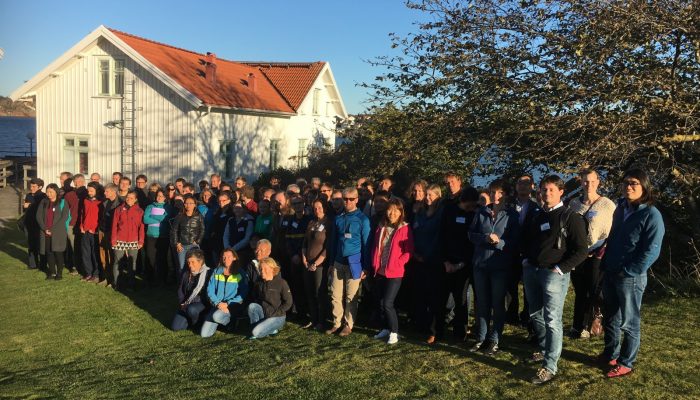
Group picture of the FRISP 2016 meeting [Credit: Anna Wåhlin]