Understanding the climate evolution of our planet is not an easy task, but it is essential to understand the past if we are to predict the future! Historic climate cycles provide us with a glimpse into a period of time when the Earth was warmer than it was today. Our image of the week looks at these warmer periods of time to see what they can tell us about the future! For example, during the Plioc ...[Read More]
Image of the week – Learning from our past!
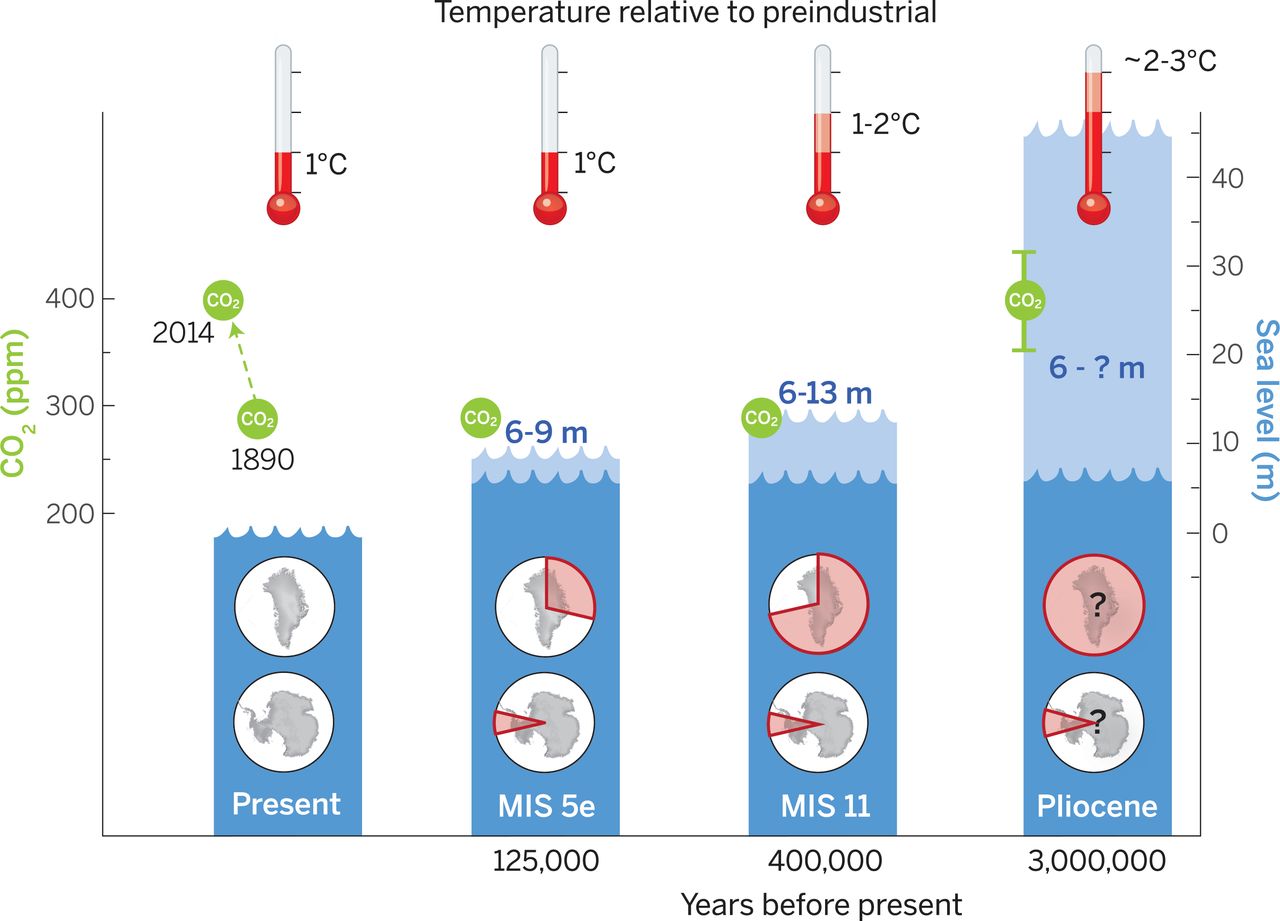
Figure 1: Peak global mean temperature, atmospheric CO2, maximum global mean sea level (GMSL) and source(s) of meltwater over the past 3 million years. The light blue area on each bar indicates the uncertainty associated with the maximum global mean sea level , and the pie charts denote the fraction (not location) of ice retreat in Greenland and Antarctica [Credit: Dutton et al. (2015)].