It might seem obvious that a warming world will lead to a reduction in glacial ice cover, but predicting the response of glaciers to climatic change is no simple task (even within the short term). One way to approach this problem is to come up with relationships which describe how glaciers interact with the world around them, for example, how the ice interacts with the air above it. Our post today ...[Read More]
Katabatic winds – A load of hot (or cold) air?

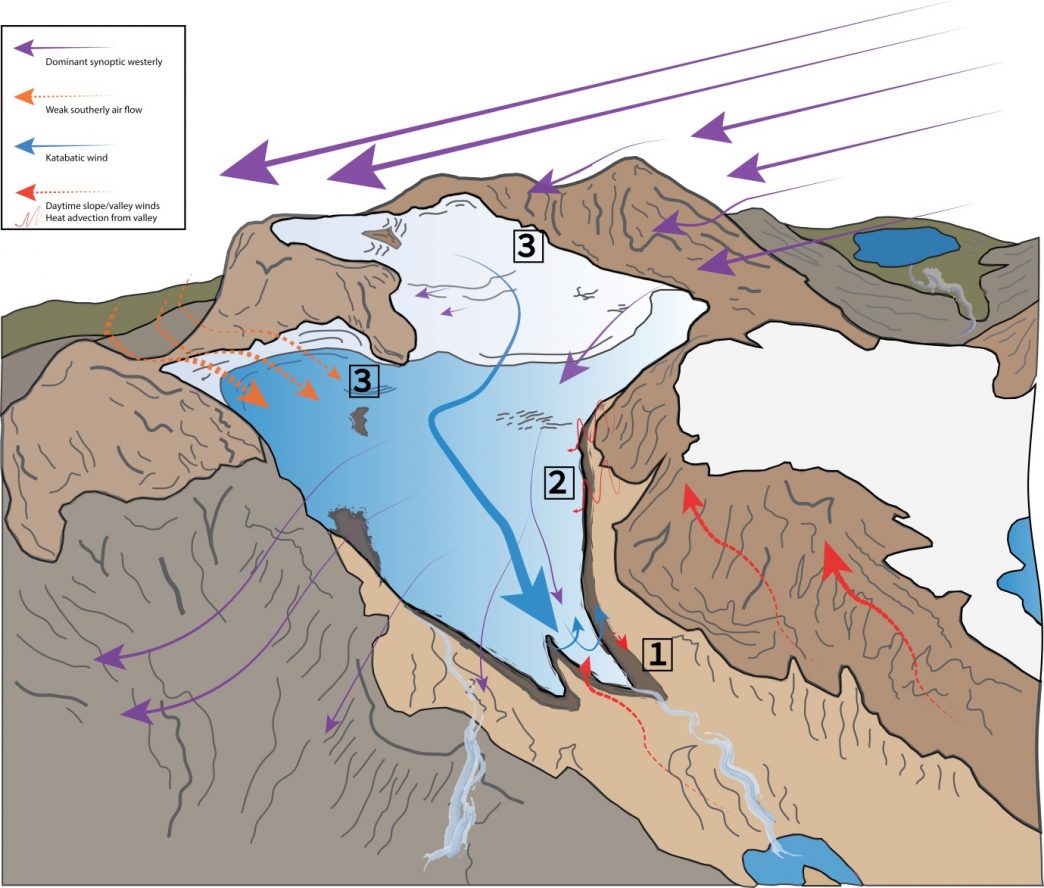
Figure 1: A schematic of the potential wind flow and interplay of local effects on Tsanteleina Glacier in the Italian Alps. The diagram represents wind modelling, measured data and observations from the field. (1) The interactions of down-glacier katabatic winds (blue) and up-valley winds/local heat sources (red); (2) the potential heat emitted from the warm valley surroundings (pink) and; (3) localised surface depressions representing glacier 'cold spots' during calm, high pressure conditions. Arrows correspond to synoptic westerlies (purple), southerly airflow (orange), katabatic winds (blue) and valley winds (red) [Credit: T Shaw, unpublished] - Click here for a larger version.
