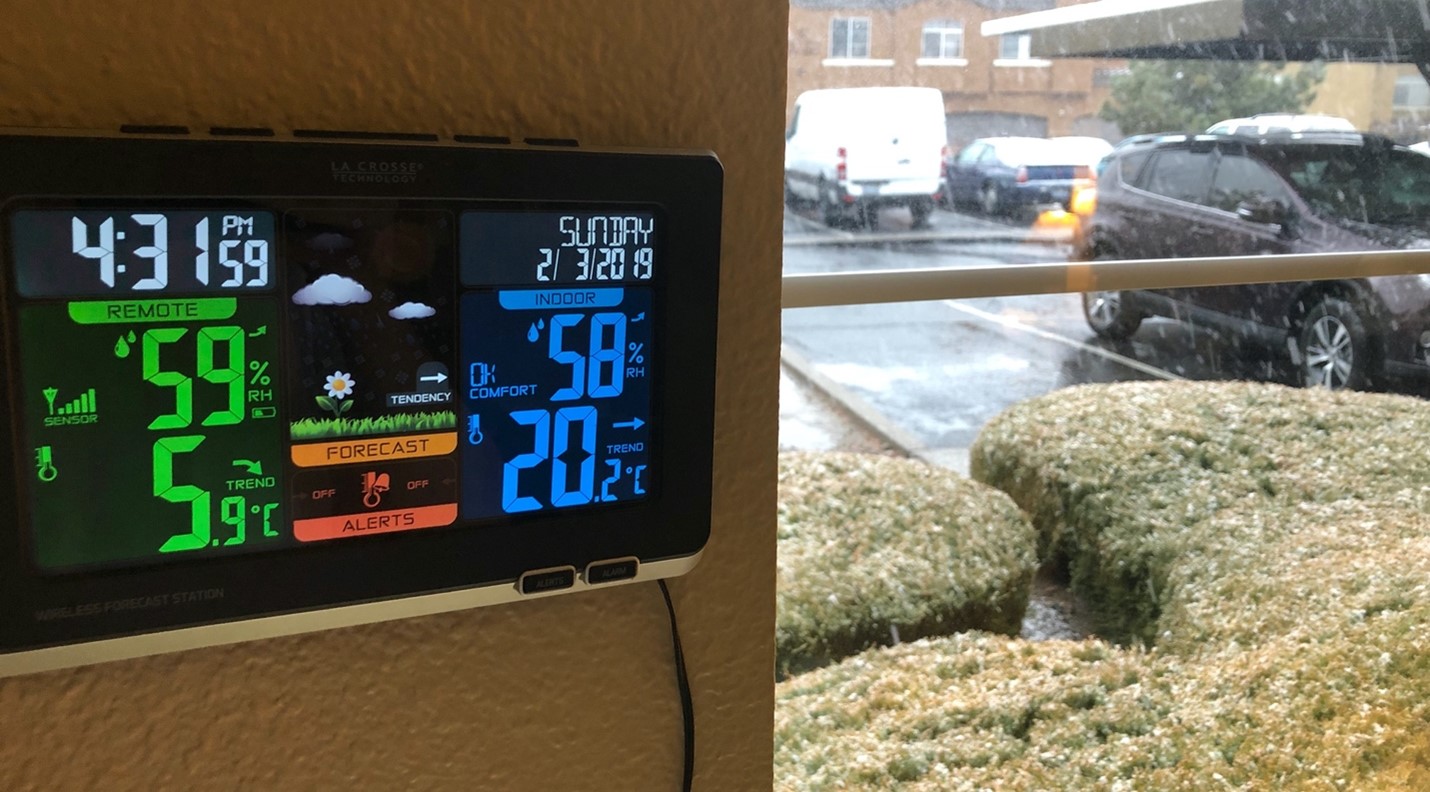
Figure 1. Too warm for snowfall? Not in some parts of the western United States. This photo from Reno, Nevada on the eastern slope of the Sierra Nevada shows snow falling despite the warm (for snow) air temperature of 5.9°C [Credit: Keith Jennings].
As a New Englander interested in weather, I was used to a fairly intuitive air temperature split between rain and snow. Once air temperature got slightly above freezing, I’d commonly see rainfall with snowfall more frequent below freezing. Then something happened when I moved to the Intermountain West of the United States. Instead of seeing rain when it was slightly above freezing, I’d see snow at seemingly paradoxically warm air temperature values, sometimes exceeding 4°C or 5°C (as shown on Figure 1 above). In this blog post, we’ll explore how snow falling at warm temperatures is at odds with its representation in many hydrologic models and learn how citizen scientists can be used to monitor this important phenomenon.
How do we know if it’s raining or snowing?
Admittedly, the observation that snow could fall at air temperatures above freezing is not a novel one. Some of the earliest work on precipitation phase, dating to the 1950s and 1970s, showed snowfall occurrences at 3°C and above. What’s interesting is the apparent disconnect between the inferred ease of predicting precipitation phase and its real-world difficulty. This particular point is important considering there are very few automated observation networks of precipitation phase.
As a result, hydrologists must use a variety of ways to split precipitation phase into rain and snow based on the value of one or several meteorological parameters. The simplest of these methods — air temperature thresholds and ranges — are the default way to partition rain and snow in many hydrologic models. Threshold-based methods use a hard cutoff whereby precipitation falling at air temperatures above the threshold value is defined as rain with snow falling at air temperatures below the threshold. Ranges add more complexity by using two thresholds. Precipitation occurring at air temperatures above the upper threshold is considered rain, while snow occurs at air temperatures below the lower threshold. Precipitation occurring between the lower and upper thresholds is defined as a mix of rain and snow. The appeal of such methods is they rely on a widely observed variable — air temperature — to split precipitation into rainfall and snowfall.
Is it really that simple?
On first glance, this makes a lot of sense. Precipitation phase is strongly related to air temperature, so it should be easy to use meteorological data to partition rain and snow at the land surface. For the most part it is. When it’s warm and humid, you’re practically guaranteed to get rain, while snow is a near-given when it’s below freezing. However, models typically use the same air temperature to partition rain and snow over large spatial extents even though the optimal threshold varies by several degrees. In general, continental locations, particularly those at high elevations, have warm optimal rain-snow air temperature thresholds (> 2°C). In contrast, lowland, maritime areas tend to have cooler rain-snow air temperature thresholds (~1°C). Another problem is the difficulty in predicting rain and snow at air temperatures slightly above freezing.
At temperatures slightly above 0°C, hydrologic models, weather forecast models, and climate models all struggle to correctly predict precipitation phase. In hydrologic models, most methods express downgraded performance between about 0°C and 4°C, regardless of the meteorological variables used. Even the best methods reach a minimum success rate in this air temperature range of about 60%. In practice, this means 40% of the time they would misidentify the phase of precipitation. These errors can then propagate into simulations of snow accumulation and melt, increasing our uncertainty of various important hydrologic phenomena such as water resources availability and rain-on-snow flooding.
Concerningly, this shortcoming affects simulations of the hydrologic cycle in temperate regions and may hinder our understanding of climate change’s influence on snowfall trends and watershed responses to changes in snowpack. The question is now: what can we do about it?
Unleash the citizen scientists
Although in-depth analyses have identified improved ways of partitioning precipitation phase, there is still no better way to identify rain and snow than visual observation. Observer networks have proven invaluable in quantifying rain-snow air temperature thresholds, spatial variability in precipitation phase partitioning, and snowfall trends. As a group of scientists at Lynker and the Desert Research Institute, we hoped to add to these data by increasing the spatial extent and temporal frequency of observations through the use of citizen science observations.
In January 2020, my colleagues and I launched a citizen science program to track precipitation phase in and around the Lake Tahoe basin in the Sierra Nevada of the western US states Nevada and California. This area is popular for winter recreation and it is a critical part of the regional water resources system (Figure 2). Our project’s premise was straightforward: use volunteer reports of precipitation phase to better monitor rain and snow. To do this, we used the existing Citizen Science Tahoe mobile application platform to host a simple survey we called Tahoe Rain or Snow (Figure 3). Using the app, users could report current precipitation phase as rain, snow, or mixed. Their observations would be automatically geotagged and timestamped, giving us critical information on where and when the report took place.
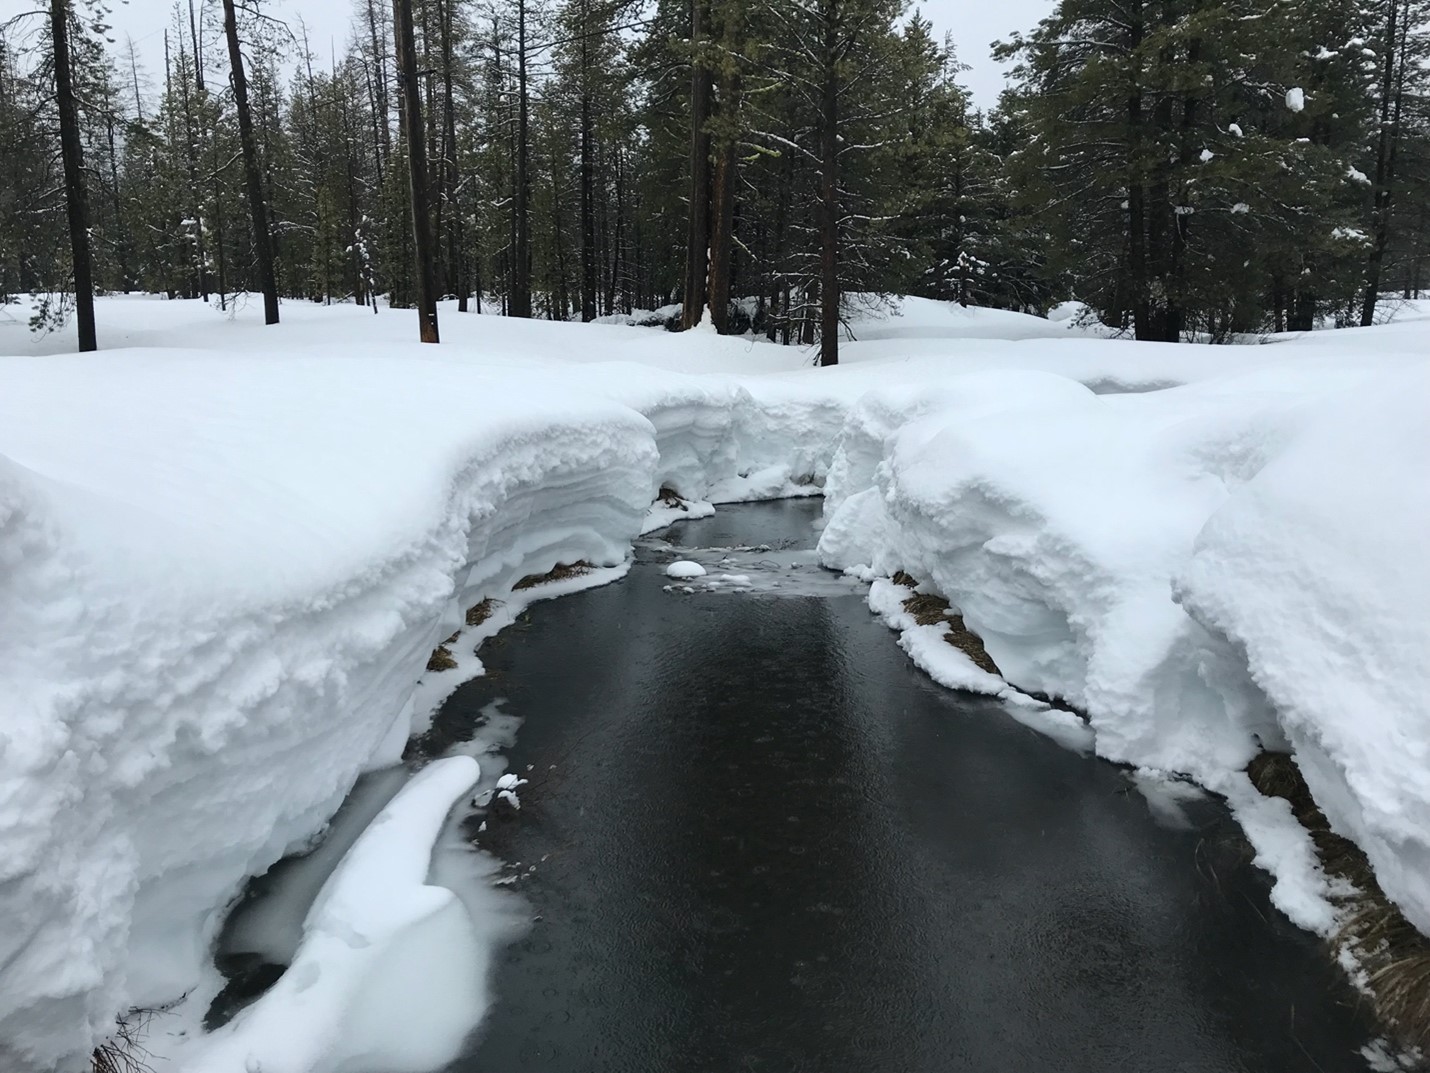
Figure 2. Snow is a critical component of regional water resources in the Sierra Nevada [Credit: Keith Jennings].
Engaging the citizen scientists
Creating an easy-to-use app was just one part of the process. We also needed to encourage people to use it. We started by attending public science events in the Reno, Nevada area, and giving presentations to any interested groups. However, the onset of the Covid-19 pandemic quickly ended in-person engagement events. We adapted by relying more on email communications and social media posts, leveraging our connections to weather, recreation, and science groups in the region. These networks proved indispensable to increasing our number of volunteers. By the end of the season, we had over 200 observers in our program.
We also had to keep citizen scientists interested throughout the winter and spring. In addition to ongoing engagement through social media and our related networks, we used a text message service to notify participants of incoming storm events that would provide opportunities to report rain and snow. A side benefit of the text service was that volunteers could respond to our messages with those of their own. Most responses were project-related, but some were humorous and even uplifting. In total, our outreach and engagement strategies enabled the collection of over 1000 observations of precipitation phase by our tireless citizen scientists. We had originally expected a few hundred at best, so this final sum happily exceeded our expectations.
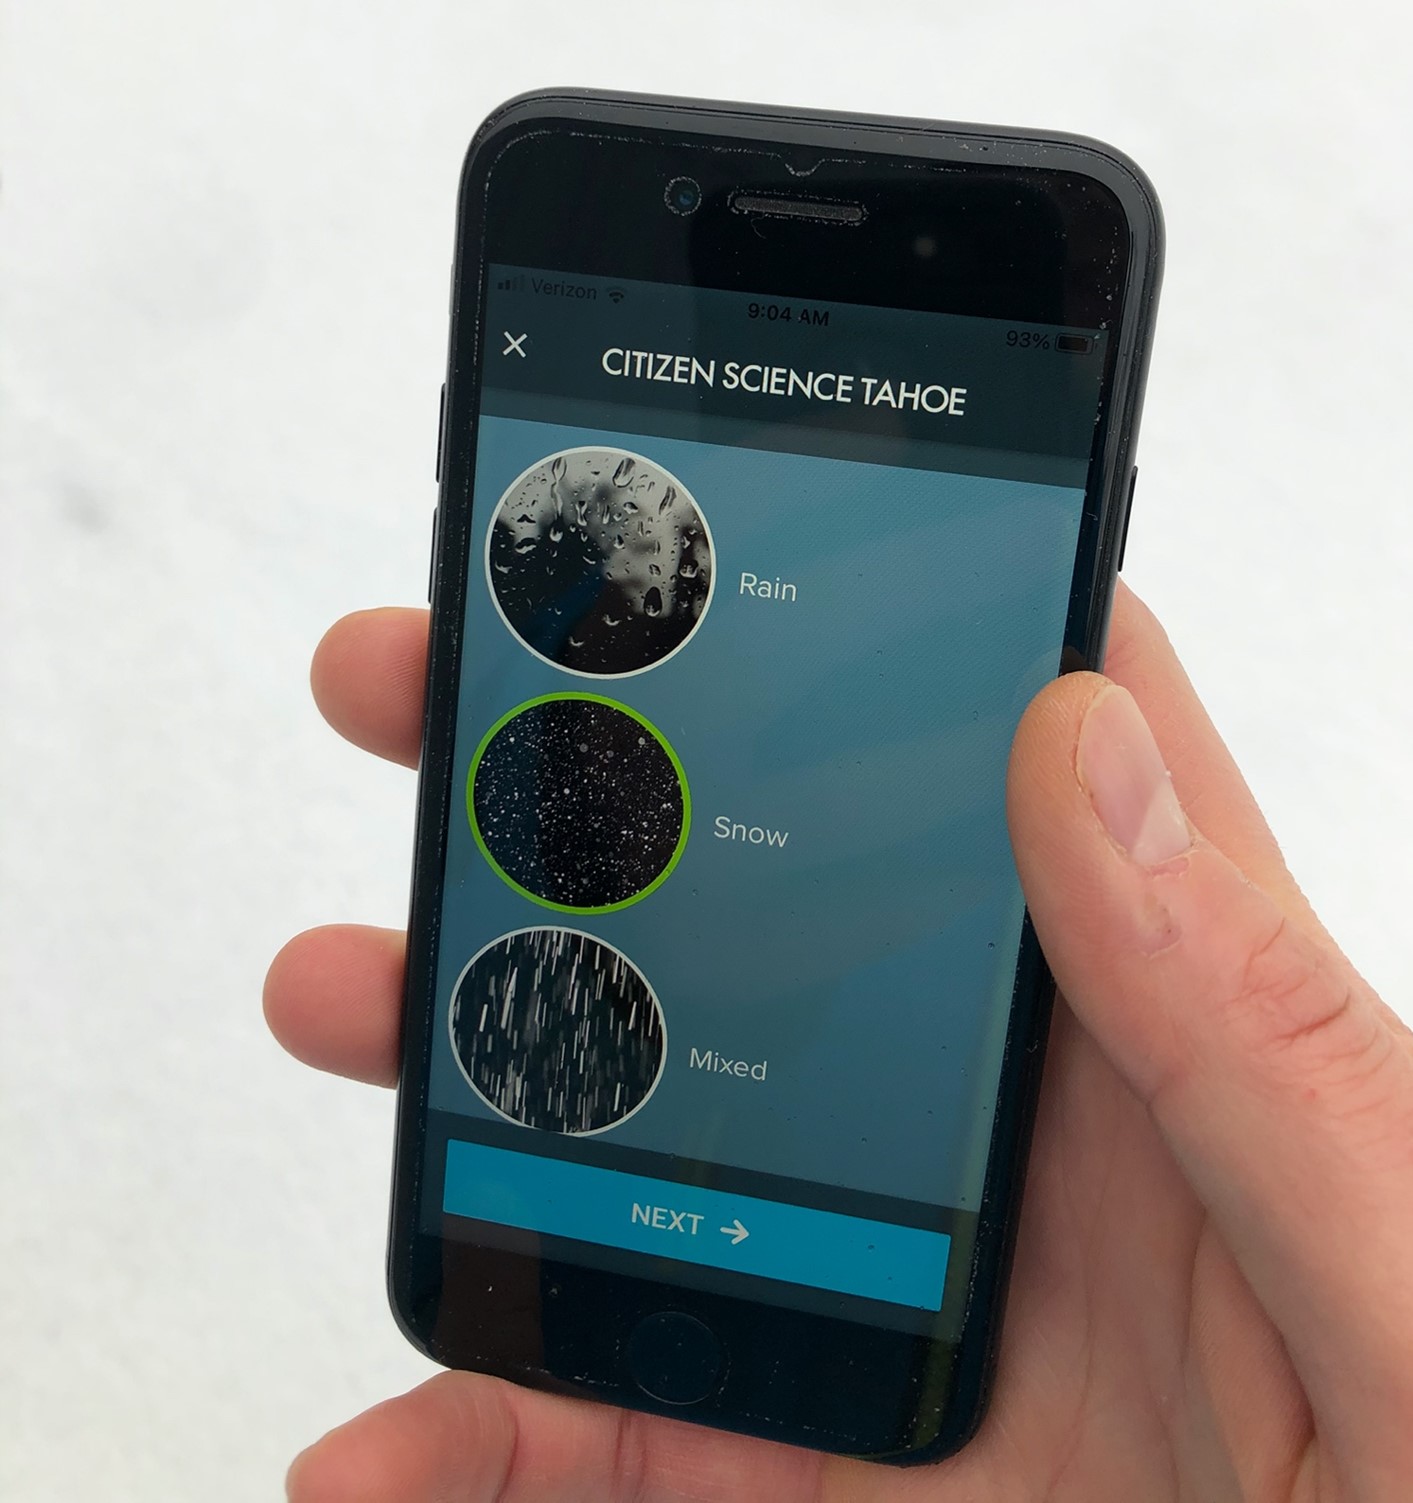
Figure 3. The Tahoe Rain or Snow app in action [Credit: Keith Jennings].
High-quality data from our observer network
Our first step after the study period was to quality control the observations, which in our case meant making sure they occurred during precipitation and at reasonable air temperature values. We first removed observations that occurred on days without any recorded precipitation from nearby automated meteorological stations. Next, we used a simple distribution model to associate each observation with an air temperature value based on measurements from the met stations in our study. We then examined how those values compared to previously reported air temperature ranges in the literature for rain and snow. Overall, we kept 96.5% of the data, which indicated a high degree of quality in the precipitation phase reports from our citizen scientists.
What did we do with all of these data?
This dataset then allowed us to further examine patterns of rain and snow in our study area. A key question we had was what air temperature value would be most effective at partitioning precipitation into rain and snow (as is done in many hydrologic models)? One way to do this is to construct a conditional snowfall probability curve that shows how the likelihood of snowfall changes by air temperature (Figure 4). These curves have a characteristic “backwards S” shape, where probability of snowfall decreases from near 100% at air temperatures near freezing to near 0% at warmer values. The air temperature value at which the curve crosses 50% can be used as a rain-snow air temperature threshold. Using citizen science data, we calculated this crossing point to be 4.2°C, which is markedly warmer than the values used in most hydrologic models. Worryingly, if a common 0°C threshold had been used to split rain and snow in our study area, we would have misidentified 71.7% of the snow reports as rain!
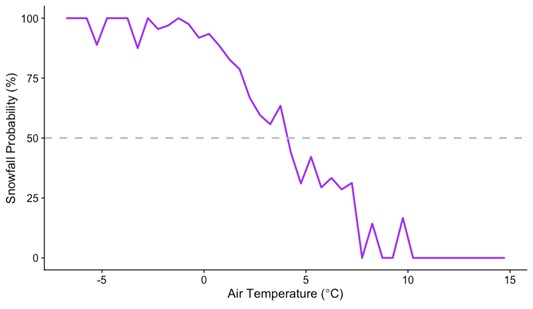
Figure 4. Conditional snowfall probability curve in our study region as computed from 1003 citizen science observations. Figure adapted from Arienzo et al. (In Press).
As the climate warms, it’s widely expected that the proportion of total precipitation falling as snow in a given area will decrease and that regional rain-snow line elevations (i.e., the elevation where snow turns to rain) will increase. The rain-snow line elevation (Figure 5) is particularly important to hydrologic modeling. Get the rain-snow line wrong and you may miss an infrastructure-damaging rain-on-snow event or incorrectly estimate the amount of water stored in mountain snowpacks! We found that citizen science data offers another way to estimate the rain-snow line, by calculating the elevation at which daily snowfall probability equals 50%. Future work could focus on more intensive observations to better constrain the problem of accurately computing the rain-snow line in mountainous regions. Overall, these sorts of analyses underscore the utility of citizen science data in monitoring our rapidly changing cryosphere.
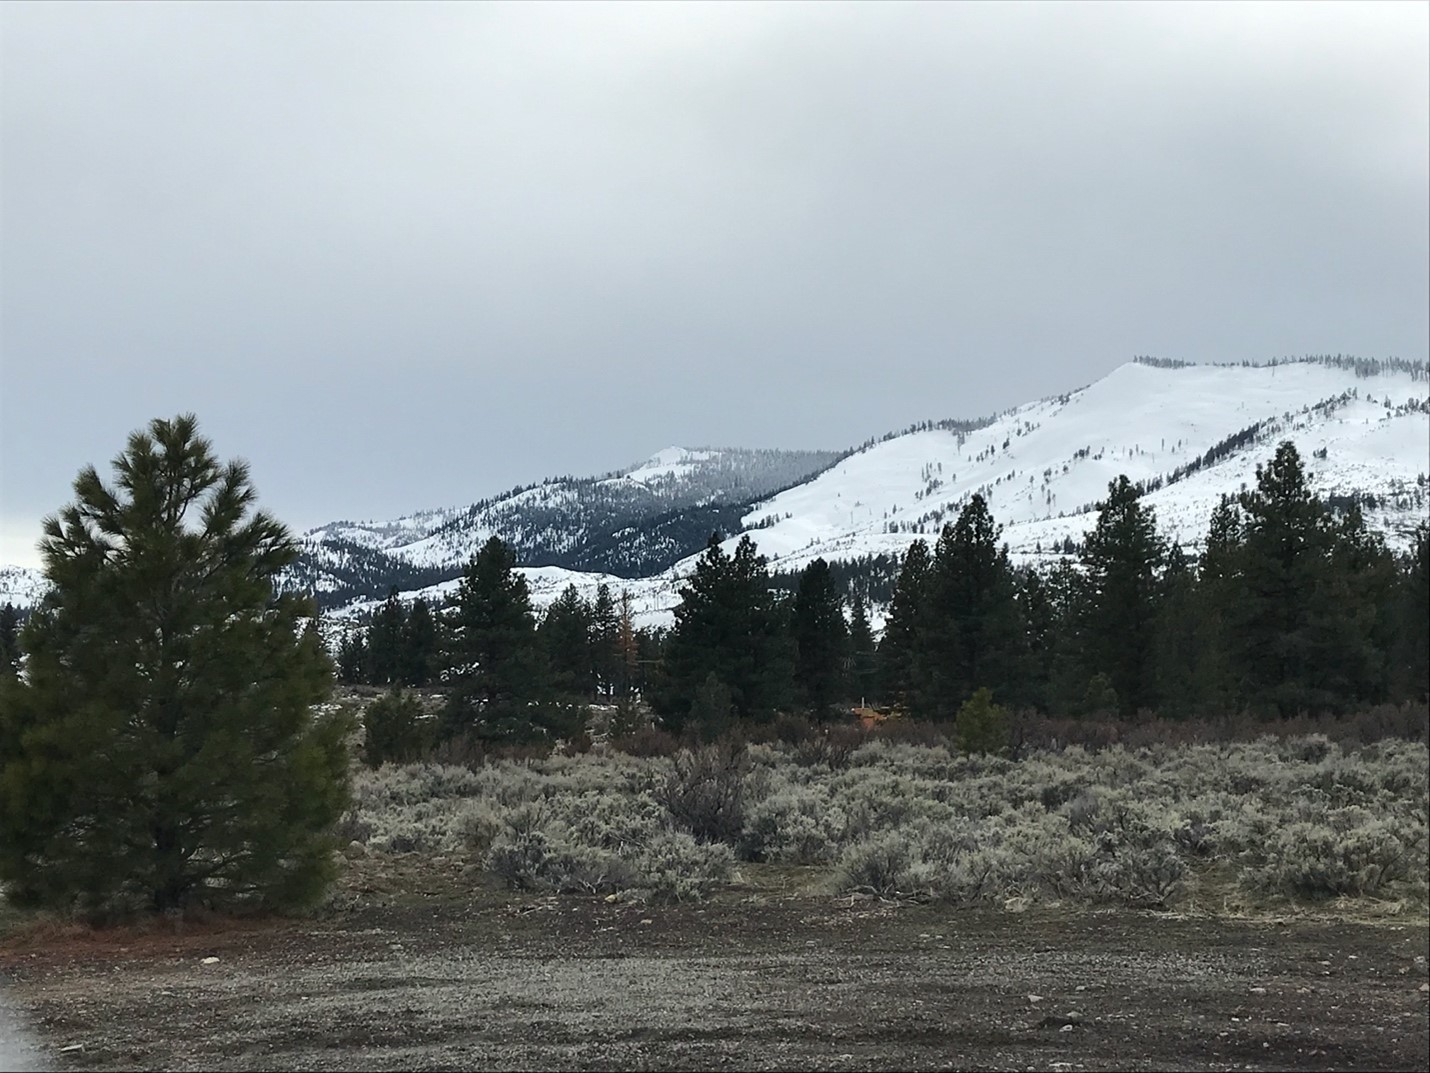
Figure 5. The transition between snow and rain can be dramatic in the foothills of the eastern Sierra Nevada [Credit: Keith Jennings].
Lessons learned and what’s next
We’ve been continuing Tahoe Rain or Snow throughout the winter of 2020–2021. We’re using the lessons we learned during our previous season to engage citizen scientists during these unprecedented times. We’re again leaning on social media and using our text messaging service to get the word out. Until recently, snow accumulation in our study area had been well below normal, yet we were still gathering observations from the citizen scientists during precipitation events. Then, starting on January 22nd, an atmospheric river event produced rapid snow accumulation over much the Sierra Nevada along with heavy valley rain. In the ten days following, we received over 250 precipitation phase reports, which is approximately a quarter of the total we received in the previous year. We hope to continue getting high-quality reports from our volunteer observers in the Sierra Nevada and beyond.
Finding and engaging our citizen scientists has been a rewarding experience and they have provided us with data points we could have never produced on our own. We’ve learned a lot about rain-snow partitioning in our study area and we’re exploring how this information can be used to improve hydrologic model output and satellite products. When it comes to making lots of observations in hard-to-reach, data-sparse places, citizen science offers a promising path forward.
Further reading
- A brief report to our citizen scientists: https://www.dri.edu/project/tahoe-rain-or-snow/
- Early work on precipitation phase includes the 1956 Snow Hydrology report from the US Army Corps of Engineers and Auer (1974): “The rain versus snow threshold temperatures.” Weatherwise 27.2. 67-67.
- Information on how and why the optimal rain-snow air temperature threshold varies: Jennings, K. S., Winchell, T. S., Livneh, B., & Molotch, N. P. (2018). “Spatial variation of the rain–snow temperature threshold across the Northern Hemisphere.” Nature Communications, 9(1), 1-9. https://doi.org/10.1038/s41467-018-03629-7
- Details on our citizen science engagement process: Arienzo, M.M., Collins, M., and Jennings, K.S. (In Press). “Enhancing engagement of citizen scientists to monitor precipitation phase.” Frontiers in Earth Science. https://www.frontiersin.org/articles/10.3389/feart.2021.617594/
- The many ways to partition rain and snow: Harpold, A.A., et al. (2017). “Rain or snow: hydrologic processes, observations, prediction, and research needs.” Hydrology and Earth System Sciences 21.1: 1-22. https://doi.org/10.5194/hess-21-1-2017
Edited by David Docquier
 Keith Jennings is a Water Resources Scientist at Lynker. His work focuses on evaluating water quantity and quality in a changing climate with remote sensing data, hydrologic model output, and ground-based observations. He’s based in Colorado, USA and loves digging snow pits. Contact email: kjennings@lynker.com
Acknowledgments
Thank you to my colleagues at the Desert Research Institute who have led different parts of the Tahoe Rain or Snow project and contributed to this post: Meghan Collins, Monica Arienzo, and Benjamin Hatchett. The Nevada NASA EPSCoR program provided the funding for this research.