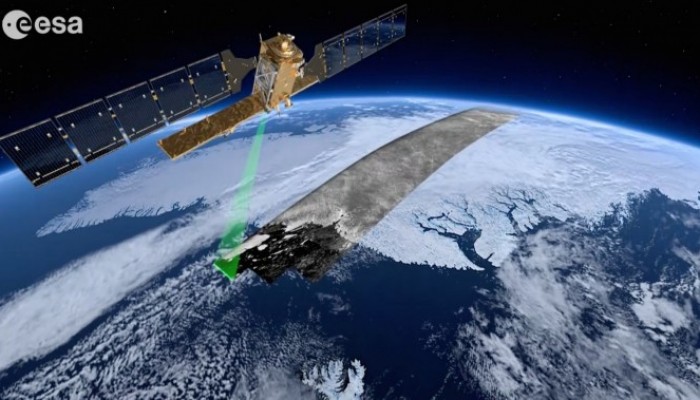
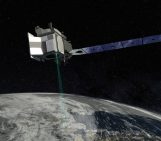
Everyday we come into contact with technology that has changed the way we work, live and even think. Yet it is still easy to forget how integral satellite technology is to our daily lives; over two thousand artificial satellites currently orbit our planet – satellites for navigation, for telecommunication, for meteorology, and for environmental and climate monitoring. The latter two categories fall within the field of Earth Observation (EO). These satellites follow either Geostationary Orbits (GEOs) or Low Earth Orbits (LEOs). LEO satellites zoom around the globe, taking just over 1.5 hours† to complete a cycle, collecting data crucial to our understanding of the Earth and its climate system. Parameters that represent the characteristics of the climate system are called Essential Climate Variables (ECVs) and in order to be able to monitor a changing climate we need to create long-term, global ECV records. Establishing these archives is our mission! In 2010 the Global Climate Observing System (GCOS), in support of the UN Framework Convention on Climate Change (UNFCCC), identified 50 ECVs. Out of these 50, 13 ECVs – those that currently are technically feasible to observe from space, that were not already covered by existing projects, and for which the European Space Agency (ESA) could provide a unique and significant contribution to the scientific community – have been selected and incorporated in 15 projects; this is the ESA Climate Change Initiative (CCI).
Focus on cryosphere
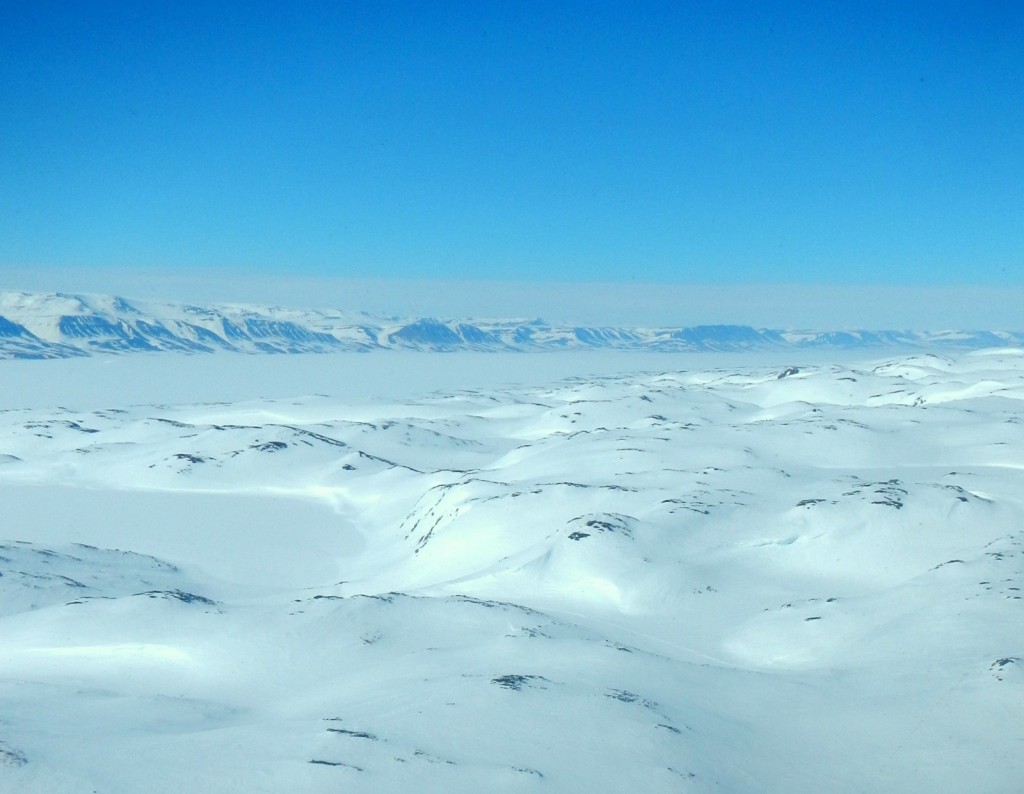
We all know the cryosphere is strongly linked to climate, contributing to the Earth’s thermal inertia. The cryosphere is a climate driver, and at the same time it is also an indicator of climate change; the cryosphere interacts with the climate system and reacts to changes in climate. Take for instance the populist example of a climate change indicator: Ice melt and associated global sea level rise. The magnitude of global and regional sea level change, and hence their consequences, need to be further explored by research such as glacier and ice sheet mass balance studies. In order to adapt to the effects of a changing cryosphere, we need to monitor the frozen parts of our world closely.
This is where the ESA CCI may provide some valuable data for your own research. Currently, there are four CCI projects specifically dedicated to the cryosphere (although there are others that are linked to cryospheric research such as ‘Sea Level’ and ‘Sea Surface Temperature’). These four cryosphere CCI projects are: ‘Glaciers’ , ‘Ice Sheets Greenland’, ‘Sea Ice’ and the new project ‘Ice Sheets Antarctica’, which will complement the original ‘Ice Sheets Greenland’ project.
Developing useful data products, what’s new?
ESA has always tried to engage the scientific community (e.g. through its Data User Element (DUE) and Support To Science Element (STSE) ), encouraging input on identifying essential EO products and organising workshops that further communication amongst the – shall we call them – producers and users. However, this process is not always straightforward. In the past, it has often been the case that EO products do not appeal to potential user communities. Products are developed which are then not exploited because they do not represent the appropriate phenomenon, at the appropriate scale or with only limited consistency (the issue of frequent, consistent, comparable data being ever present). It is as if EO scientists, field scientists and modellers speak fundamentally different languages. The CCI projects have therefore been specifically designed with climate scientists in mind, centrally involving the climate community in each project. Requirements of the user communities were rigorously assessed and incorporated in the products’ development, and in addition a separate CCI project wholly dedicated to climate modelling, the ‘Climate Modelling User Group (CMUG)’, was set up.
Research at the ESA Climate Office
Apart from providing these data products we also do some of our own research. An example of a current study is an analysis of Arctic sea ice in relation to El Niño events. CCI datasets including Arctic sea ice concentration and thickness variables enable research to be carried out into the major influences of climate variability. We know that the Arctic sea ice trend is steadily decreasing annually but the effect of inter-annual climate variability is less well constrained. Using the CCI Sea Surface Temperature (SST) datasets, one of the most direct climate links of El Niño, correlations with sea ice can be investigated. El Niño events originate in the tropical Pacific with warmer temperatures affecting the global climate. These changes can be traced through the ECVs allowing us to determine the time it takes for it to affect global climate and in particular, Arctic sea ice. By establishing how inter-annual global climate variability influences sea ice, we can aid predictions of future events. EO satellites help provide some of the most globally comprehensive climate records, significantly aiding our understanding and adaptation to these climatic changes.
The CCI datasets provide climate records for a range of ECVs. However, cryospheric research is not simply limited to the above-mentioned CCI projects. Further research at the Climate Office focuses on using some of the land-based climate variables (including fire, land cover and soil moisture) as proxies for permafrost monitoring. Permafrost is an aspect of the cryosphere that cannot be directly monitored from space, but the development of proxies will support global scale monitoring, crucial to understanding changes in permafrost conditions.
EO has already, and continues to make significant changes to the way we investigate and gather new information about the planet we live on. However, there is still much that we do not yet know and hope to discover with the on-going monitoring of ECVs. As the products are updated to include more recent data, developing long-term records, our ability to decipher climate patterns and responses will be significantly aided.
Our changing planet
Nature is in a state of flux. We monitor our ever-changing world so we can understand the underlying processes. Our motivations may be economic or altruistic; they may be due to ambition or a thirst for knowledge. However, one thing is certain, the impacts of climate change will affect us all. Satellites help provide us with the bigger picture. Producing the ECV archives is one step towards effective monitoring in support of the international climate change community.
There are many words that describe Earth from space: unique, beautiful, vulnerable, alive – they all fit the bill. A recent ESA mission to the International Space Station was named Blue Dot; a rather fitting description of our place in the universe. In Jules Verne’s classic, the debate about how long it takes to journey around the world starts off with the quote: “The world has grown smaller, since a man can now go round it ten times more quickly than a hundred years ago.” Today LEO satellites orbit the world about 15 times per day with a repeat cycle of 12 days – that’s nearly seven times faster than Phileas Fogg’s record. The world has not grown smaller, but in fact the world that we see is vast and – to a degree – still unknown. Whatever your Weltanschauung, your perceptions of the world, your motivations and reasons for undertaking research, ultimately we monitor our planet for the benefit of society and the environment. Together, let us try to understand our planet and its climate system better!
To access any of the ESA CCI datasets please visit our website at http://www.esa-cci.org/ and click on the download link on the individual project sites. Registration is required but all data are free of charge and we welcome any comments with regard to use of the data.
Anna Maria Trofaier is a Postdoctoral Research Fellow and Anne Stefaniak is a Young Graduate Trainee working for the European Space Agency’s Climate Office at the European Centre for Space Applications and Telecommunications (ECSAT) on the Harwell-Oxford Campus in the UK.
You can follow them on Twitter @WhinnyHowe, @AnneStefaniak and @esaclimate.
† This approximation is for Copernicus. LEO cycles can be anywhere between 1 – 2 hours depending on altitude.


Pingback: One year a climate scientist | coldspaces