
One of the most profound consequences of past climate changes are the geologically rapid (<100,000 year) changes in global topography. For thousands of years, large ice sheets, similar to what currently exists in Greenland and Antarctica, waxed and waned on North America and Europe. Only 20,000 years ago, if you were sitting in the middle of Canada or Sweden, you would be under thousands of meters of ice (Figure 1). Changes of the Earth’s surface at this scale had many consequences. The buildup of these ice sheets caused the sea level to fall, as the water became trapped in places where it is now land. The drop in sea level allowed humans to cross over from Asia to Australia and the Americas. The height of the ice sheets affected climate by changing the Earth’s wind patterns, ocean currents, and reflectivity. We know today, that the growth of these ice sheets was triggered by changes to the Earth’s axis of rotation and a decrease of atmospheric CO2.
Reconstructing the configuration of past ice sheets allows us to determine past sea levels. In a study published recently in Nature Communications [1], we present a preliminary reconstruction of ice sheets and topography for the past 80,000 years.
Why investigate past ice sheets and topography?
Often I am asked: “why make reconstructions of past ice sheets and topography”? Ultimately, it comes down to understanding how climate might change in the future. Climate scientists create complex models to show how climate can change if there are changes in the Earth’s system, for instance increasing anthropogenic CO2 in the atmosphere. You can run these models to project the future climate, but how do you know if these models are producing something realistic? That is where paleoclimate modeling comes into play. The climate conditions in the past varied quite a lot. For instance, the Last Glacial Maximum (LGM) period, about 20,000 years ago, had a global temperature that was several degrees colder than the present. The increases in temperature between the LGM and the early Holocene (12,000-8,000 years ago) are similar in magnitude to what might be expected in the upcoming centuries (although, the current and future warming is occurring over a much shorter time). You can test the climate models in different periods and compare them to reconstructions of past climate from geological records. To model past climate, you need to have a baseline of what the Earth’s surface looked like, and that is where our reconstruction work comes in.
Finding the maximum ice volume at the Last Glacial Maximum
We wanted to create a baseline reconstruction of the LGM when sea level was at a low point because global ice sheet volume was at a maximum (large volumes of water were transferred from the ocean to land-based ice cover). The purpose of this exercise was to calibrate our ice sheet reconstruction and ensure that it is plausible. The way to test the model is to check how it changes sea levels at different places. When ice sheets build-up or collapse, sea level does not fall evenly in all places. The buildup of the ice sheets causes changes to the Earth’s gravity and rotation, so water will distribute unevenly. Closer to the ice sheets, their weight causes the land to subside, and water gravitates towards the ice mass. This causes the sea level near the ice sheet to be higher than the present.
We first adjusted the ice sheet reconstruction to reproduce past sea-level changes in the areas with pre-existing ice sheets. After the ice sheets melted away, the land slowly rebounded back, which caused the sea level to fall. We adjusted the local ice configuration to reproduce the geological records of this fall. The pattern of sea-level change is strongly related to the size and the shape of the ice sheets at the LGM.
After doing this, we calculated sea level on a global scale and compared them with the geological records in tropical areas at the LGM. In these areas, sea-level change is predominantly related to the overall reduction of ocean water volume and is not as sensitive to where the ice was distributed. When we did this analysis, our model was able to reproduce the sea-level fall in tropical areas without requiring further adjustment. We found that the global average sea-level fall was about 116 m below present.
Ice sheets before the Last Glacial Maximum
The second goal was to create a reconstruction of the period before the LGM, from 57,000-27,000 years ago, a period which is known as Marine Isotope Stage 3 (MIS 3). This is a period when the climate was very unstable. The Earth’s rotational axis was in a position that would be favorable for melting of the ice sheets, but CO2 concentrations were relatively low. In the Northern Atlantic region, the climate rapidly fluctuated between cold and warm periods.
Marine oxygen isotopes are often used to infer past sea level changes (and therefore ice volume) for periods before the LGM because direct geological evidence of sea level and ice-sheet extent is difficult to find. There are two major isotopes of oxygen, 18O and 16O. 18O atoms are heavier as they have two extra neutrons in their nuclei. Due to this, 18O preferentially stays in the ocean when water evaporates. When the ice sheets build up, 18O concentrations in the ocean increase relative to 16O. Marine oxygen isotope concentrations are measured from the shells of organisms called foraminifera. When the foraminifera grow, the oxygen isotope concentration in their shells will be dependent on the concentration of the ocean water. After the foraminifera die, they collect on the floor of the ocean. By collecting sediment samples, foraminifera that died at different time periods can be collected, and the oxygen isotopes of the ocean during the past can be inferred. The concentrations of 18O in the foraminifera during the MIS 3 period are high, so it has been presumed that ice volume was also high. This interpretation is complicated by the fact that the 18O record in foraminifera shells can also record changes in ocean temperature (also known as geothermometry).
In our study, instead of relying on marine oxygen isotopes to infer ice volume, we relied on land-based evidence of where there were ice-free conditions in MIS 3. This is difficult to do because the techniques used to find the age of geological deposits become more unreliable when the age is over 30,000 years old. The sliding from the ice sheets also scraped away a lot of the older sediments, making it an incomplete puzzle. Despite this, there is increasing evidence that the ice sheets in Europe were restricted to mountainous areas, and therefore were small in extent. For North America, there are conflicting interpretations of the MIS 3 ice-sheet configuration, so we created two reconstructions to accommodate this (Figure 2).
When summed together, our geologically based reconstruction has significantly less ice volume than inferred by the marine oxygen isotope records. This presents a new challenge for inferring past climate since it becomes more difficult to know past ice sheet configurations if marine oxygen isotopes are not reliable indicators of ice volume.
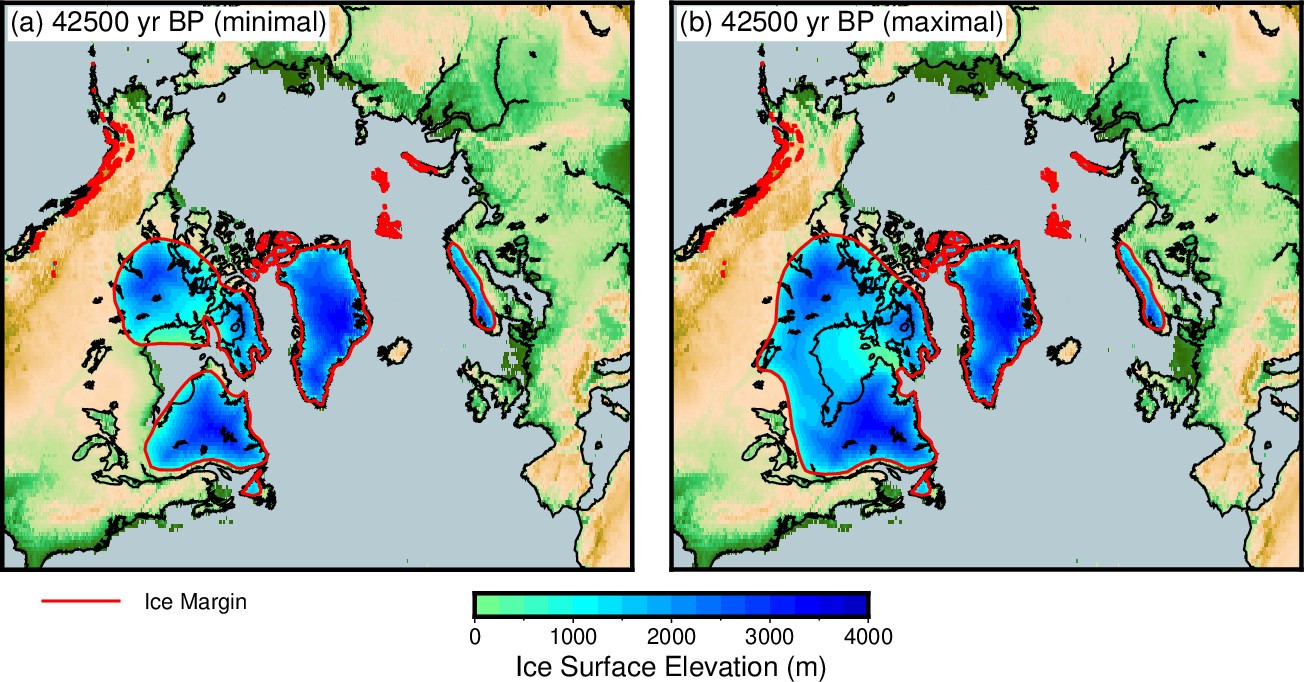
Figure 2: Paleotopography of the Arctic during Marine Isotope Stage 3, at 42,500 years before present (yr BP). There are two configurations for the ice sheets in North America, reflecting the uncertainty when interpreting the geological records.
Reflections
This ice sheet reconstruction study is the culmination of over 10 years of work, that began in earnest during my Ph.D. at the Australian National University. However, my interest in ice sheets began during my childhood in Manitoba, Canada. My hometown of Arden, Manitoba, Canada is situated on an ancient beach that formed during the melting of the Laurentide Ice Sheet, which once covered most of Canada. The picture below is located where the elementary school I attended once stood. When I was a student, we were told stories that this was once the shore of a massive lake named after the person who came up with the idea of former glaciations in Europe and North America, Louis Agassiz. Perhaps because of this, I gravitated towards studying what the ice sheets once looked like.
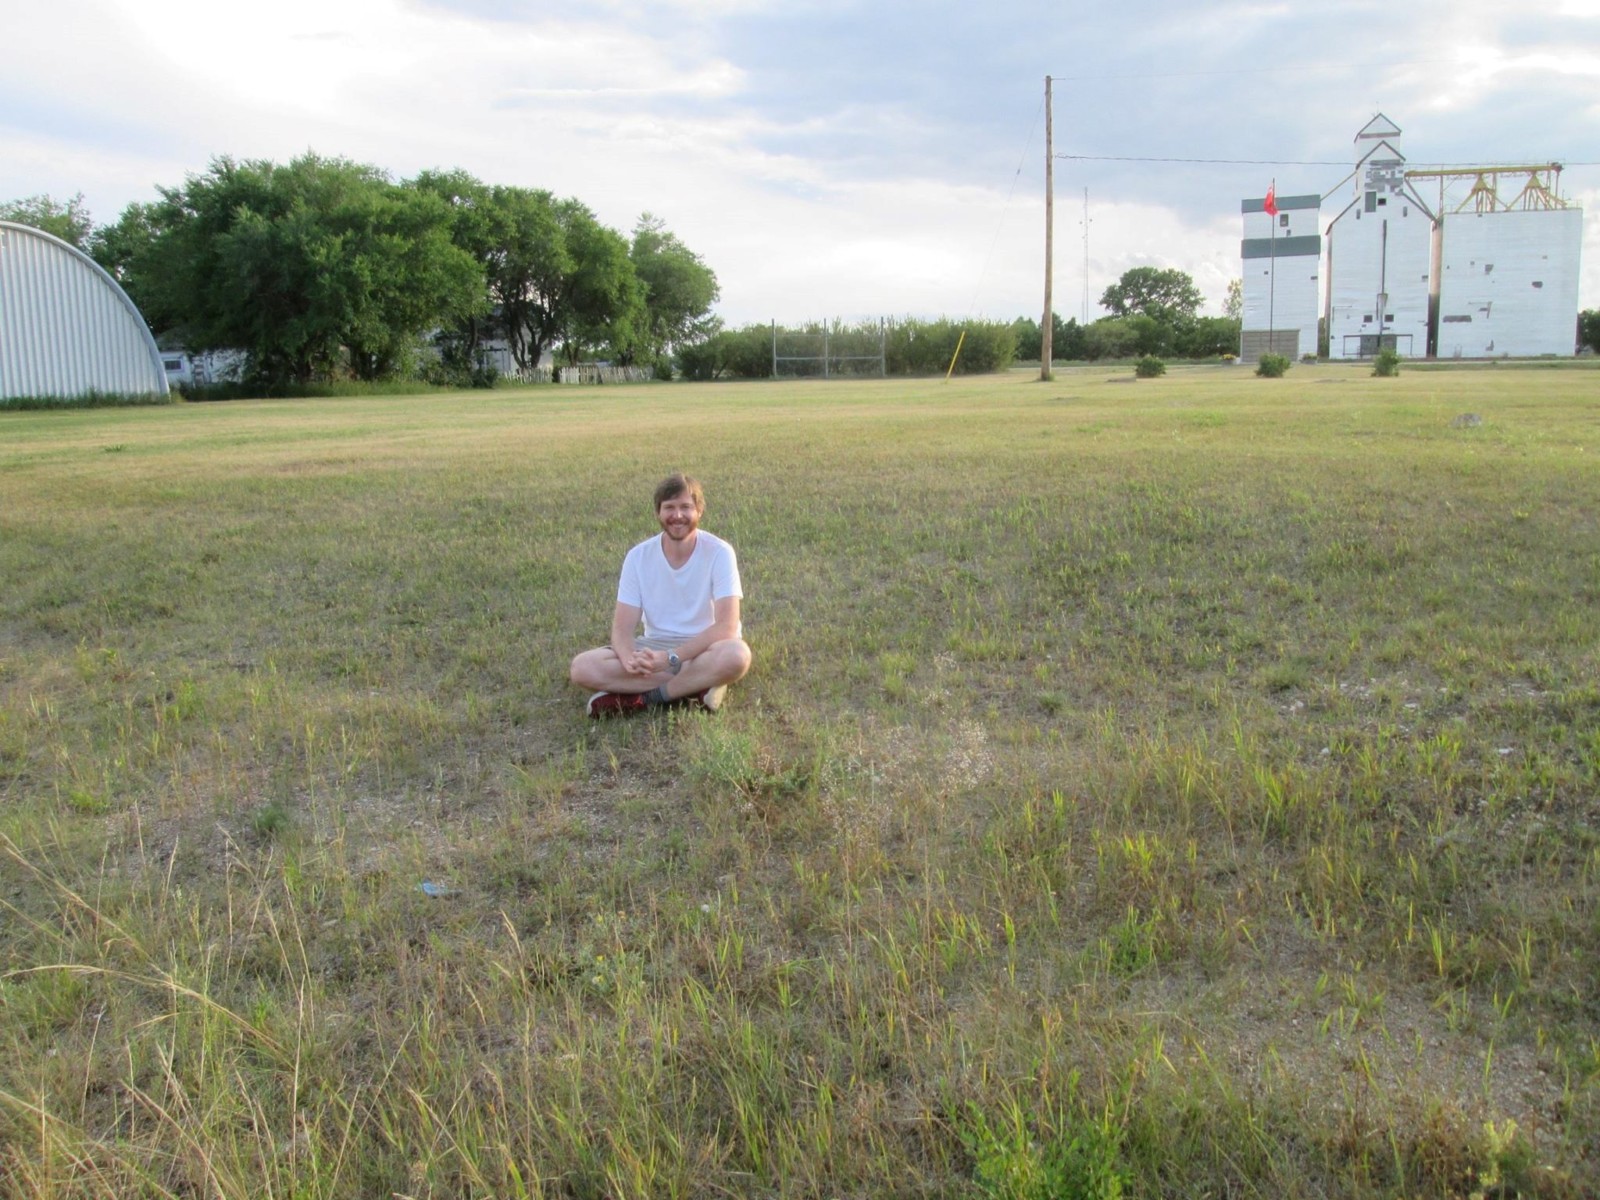
Figure 3: A picture of me sitting on the Upper Campbell beach of Glacial Lake Agassiz in Arden, Manitoba Canada. This lake existed when the ice sheets in Canada blocked northward drainage of water.
Creating a global ice sheet and topography reconstruction of the past was a lot of work. It required the development of programs and scripts to automate a lot of things I had done by hand during my Ph.D. (when I only worked on North American ice sheets). I had to read a lot of papers with information on ice sheet behavior, climate change, glacial geology, geological dating techniques, and sea level change. My archive has over 3,500 papers! I am pretty privileged to have spent time in departments with a wide range of expertise.
At the end of this, I am very proud to have been able to complete my goal of creating a global ice sheet reconstruction stretching back tens of thousands of years. I am very thankful for my colleagues that helped me. The past 10+ years of academic life has had many ups and downs, and there were times when I did not think I would be able to get to this point. I, of course, have many plans to continue this work, as this reconstruction is in many ways preliminary. Academic research is a precarious vocation, though, and it is still a very open question on whether or not this will be possible.
This post has been edited by the editorial board.
References
[1] Gowan, E.J., Zhang, X., Khosravi, S., Rovere, A., Stocchi, P., Hughes, A.L., Gyllencreutz, R., Mangerud, J., Svendsen, J.I. and Lohmann, G., 2021. A new global ice sheet reconstruction for the past 80 000 years. Nature Communications, 12(1), pp.1-9. https://doi.org/10.1038/s41467-021-21469-w