The looming El Niño is likely to hit hard this year, bringing bracing moments to the already warming world. Extreme weather events are no longer just anomalies; they have become far too common in this new reality. It’s clear that our environment is under unprecedented stress.
Experts warn of the costs of inaction: between 1995 and 2024, nearly one million lives have been lost due to climate-related disasters globally, with direct economic damages soaring to nearly 4 trillion Euros. Consequently, environmental risks, including extreme weather events as well as biodiversity loss and ecosystem collapse, ranked as the top two global risks in terms of severity over the next decade (The Global Risks Report, 2026). The urgency for collective climate action has never been clearer.
In response to this crisis, countries around the world are stepping up efforts to enhance their Monitoring, Reporting, and Verification (MRV) systems. These systems are crucial not only for improving transparency and accountability but also for effectively tracking and reducing greenhouse gas (GHG) emissions (e.g., UNECE-MRV). Among GHGs, methane has emerged as an important concern (e.g., Global Methane Initiative, UN Climate Action). Methane warms the atmosphere approximately 25 times more than carbon dioxide over a 100-year period. At the same time, unlike carbon dioxide that stays in the atmosphere unaltered for centuries, methane breaks down in about a decade.
That shorter lifetime and high global warming potential make methane one of the fastest levers available for slowing near-term warming.
IPCC, 2021
In 2021, nearly 160 countries signed the Global Methane Pledge, committing to cut methane emissions by 30% by 2030 (Global Methane Pledge). But for such a commitment to be meaningful, countries must know how much methane they emit that eventually stays in the atmosphere, where and how those sources are distributed, and how to mitigate them without hampering economic stability. For India, one of the fastest-growing economies amid large emissions and climate change mitigation, the question has been difficult to answer.
Why is India’s methane difficult to address?
India’s methane footprint is substantial and distributed across multiple sectors. India has one of the world’s largest cattle populations, which is a major source of methane. Adding to that, rice paddies contribute to seasonal methane emissions: emissions increase during the monsoon, the main rice-growing season in much of the country, as flooded fields create ideal conditions for methane-producing microbes. Coal mines, landfills, wastewater systems, and parts of the oil and gas sector are other contributors. Before implementing emission-reduction strategies, it is crucial to estimate methane emissions accurately. This is to identify prioritized sectors or regions for effective mitigation.
According to India’s Fourth Biennial Update Report (MoEFCC., 2024), India emits 19.6 teragrams of methane compared to around 608 teragrams of global emissions each year. But the global methane inventories draw a different figure for India.
The widely used global inventory, the Emissions Database for Global Atmospheric Research (EDGAR; Crippa et al., 2022), often estimates higher methane emissions in India than the national inventory.
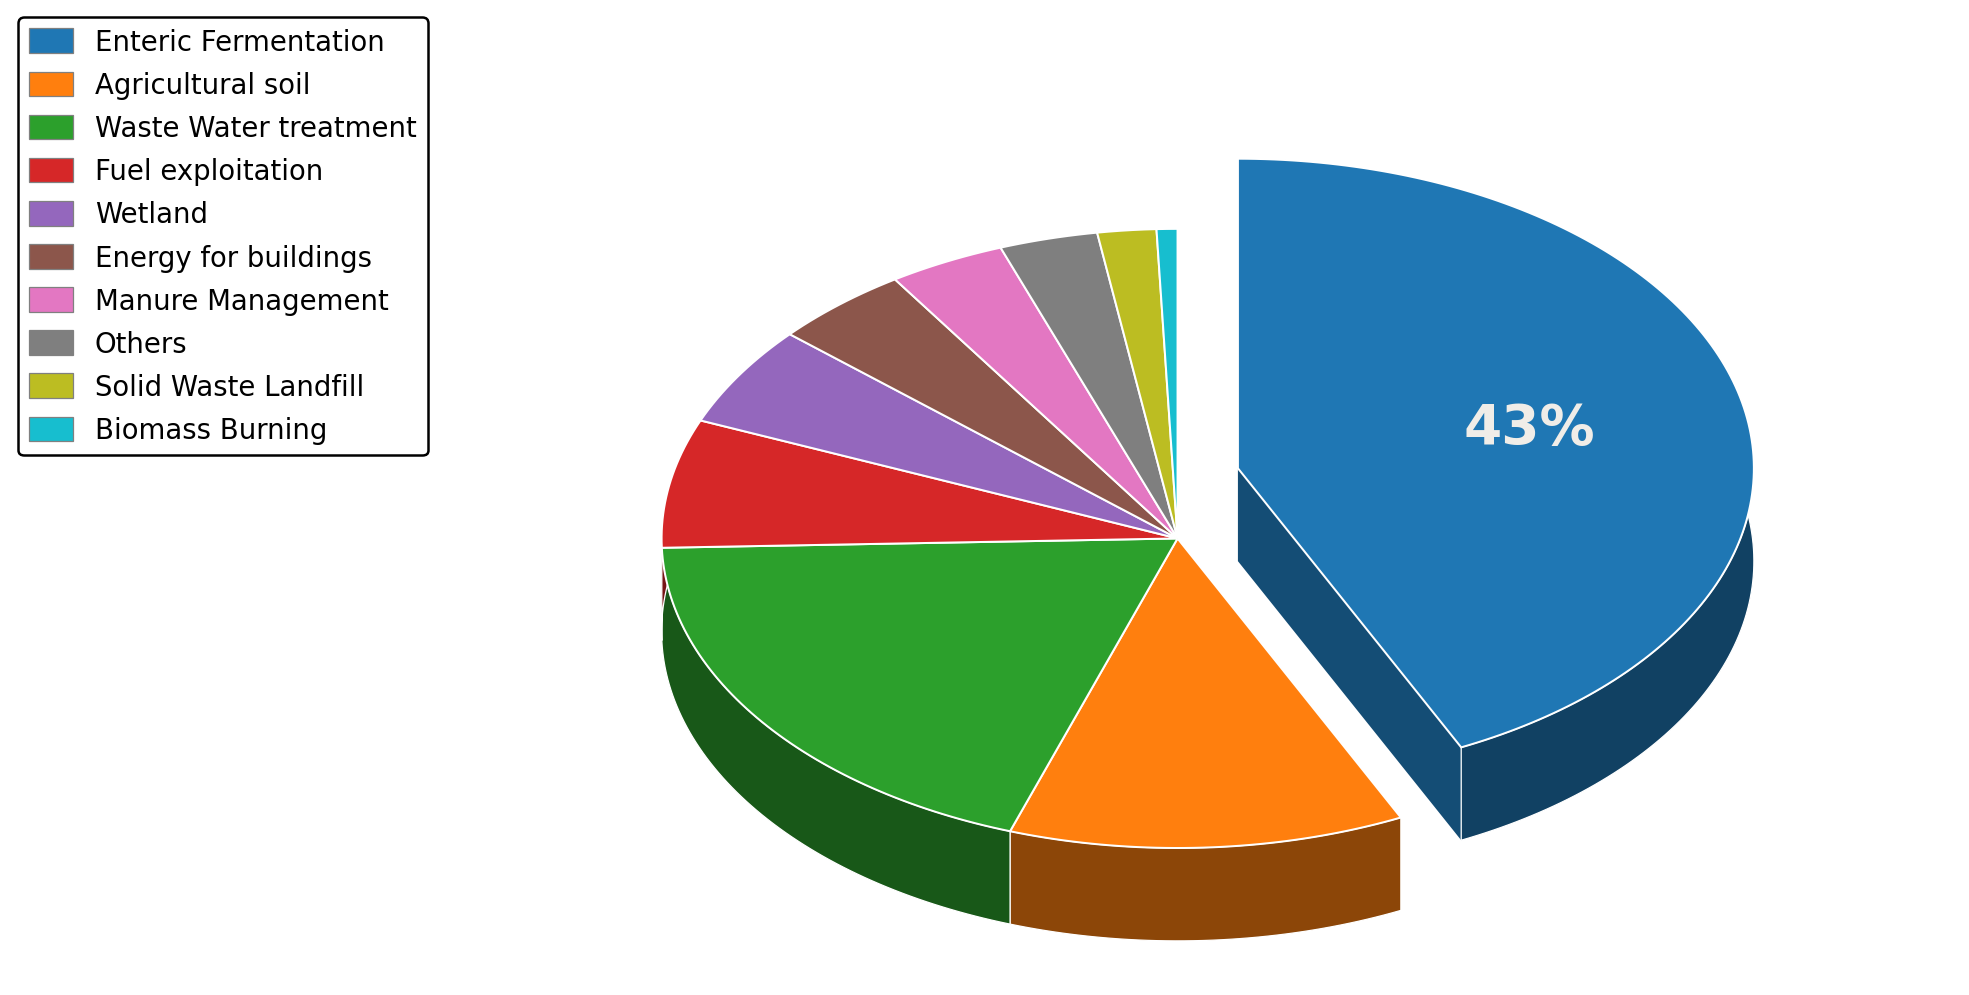
Figure 1. Sector-wise anthropogenic emission components over India. Enteric fermentation from livestock (43%) dominates, followed by wastewater treatment, agricultural soils, and fuel exploitation (Crippa et al., 2022; Bloom et al., 2021; Kaiser et al., 2012).
In simple terms, an inventory is an accounting of emissions from different human activities and sectors across the country. These estimates are generally built using a bottom-up approach, where emissions are calculated from activity data such as livestock numbers, rice cultivation area, or coal production, combined with emission factors.
Traditional methods that rely on statistical estimates or the interpolation of localized information to represent the country are highly incapable of reflecting reality.
These global inventories are essential, but they do not directly support informed decision-making for effective emission-reduction strategies. For instance, emission factors may not fully capture Indian conditions, and activity data may be incomplete or outdated. Thus, the accuracy of emission estimates across India is questioned, despite their importance to climate mitigation plans. Without sufficient observationally driven information and a robust estimation technology, it has been difficult to determine which emission estimate is closer to reality and where to prioritize mitigation efforts.
Looking at methane from space
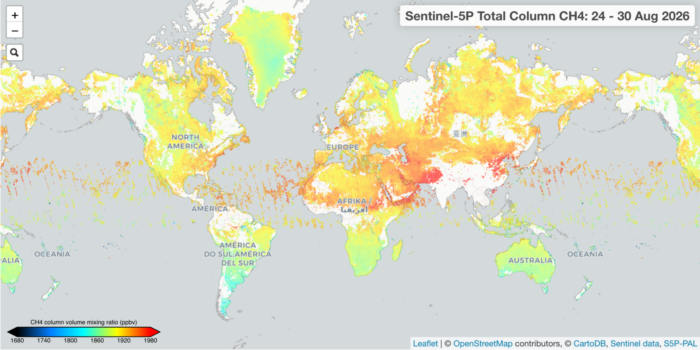
To move beyond activity-based estimates alone, we turned to atmospheric observations. A key instrument in our study is TROPOMI, the TROPOspheric Monitoring Instrument aboard the European Space Agency’s Sentinel-5P satellite that scans the globe daily. It measures the spectral absorption of light corresponding to methane molecules in the atmosphere.
Those satellite measurements, when analyzed with complex radiative transfer equations and numerical techniques, give information on the total methane in a vertical column of air extending from the Earth’s surface to the top of the atmosphere.
This quantity is called XCH4, or the dry-air column-averaged methane mixing ratio. Because TROPOMI provides broad coverage at relatively fine spatial resolution, it allows us to observe methane across agricultural regions, urban areas, industrial belts, wetlands, and coastlines. Methane sources are spread across a vast and diverse landscape. Satellite observations help us see methane emission patterns at a broader spatial scale, though they do not directly distinguish sector-wise emissions.
However, satellite data alone are not enough, since methane observed over a particular place does not necessarily originate there; winds transport and mix gases over long distances.
Bringing together space-borne measurements, surface observations, and models
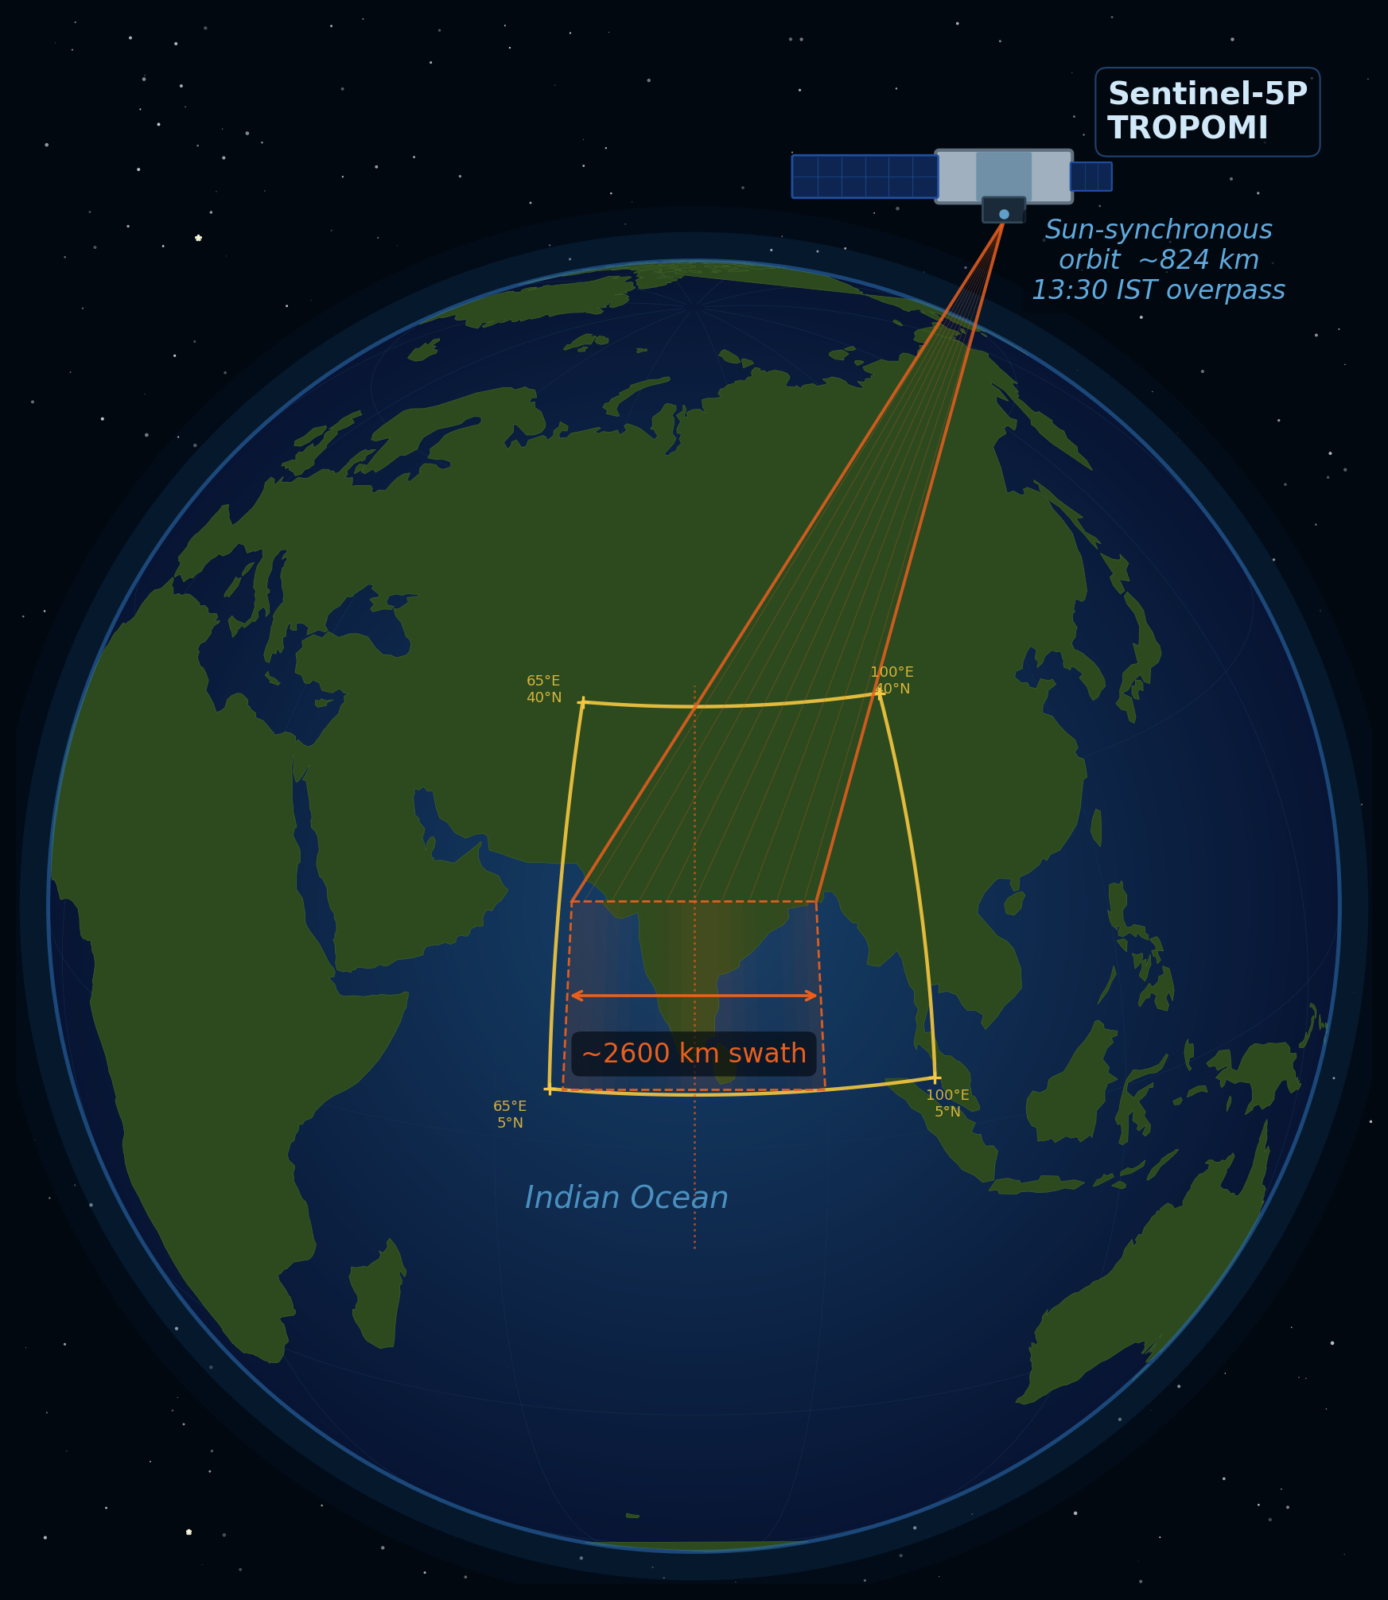
Figure 2. Illustration of the study domain and satellite retrieval. Basemap retrieved from Natural Earth (Public domain).
To transform what the satellite sees into emissions, we implemented the atmospheric transport model WRF-GHG (Weather Research and Forecasting Model coupled with GHG modules), thereby enabling us to understand the effects of atmospheric dynamics. With the model, we represented how methane can be emitted, transported, mixed, and distributed through the atmosphere. It also helped us understand how methane emissions peaking over agriculture-dominated regions of India, such as the Indo-Gangetic Plain, are transported, and how a shallow atmospheric boundary layer during winter intensifies their accumulation near the surface. We then compared the simulated methane fields with TROPOMI XCH4 observations. Where the model and the satellite agreed, we had more confidence in the emissions used in the model. Where they differed, it indicated that the underlying inventories likely required correction.
Acknowledging the complexities of the atmospheric model, we emphasize a major challenge for India’s methane science: the ground-based methane monitoring network remains limited.
Inverting the problem
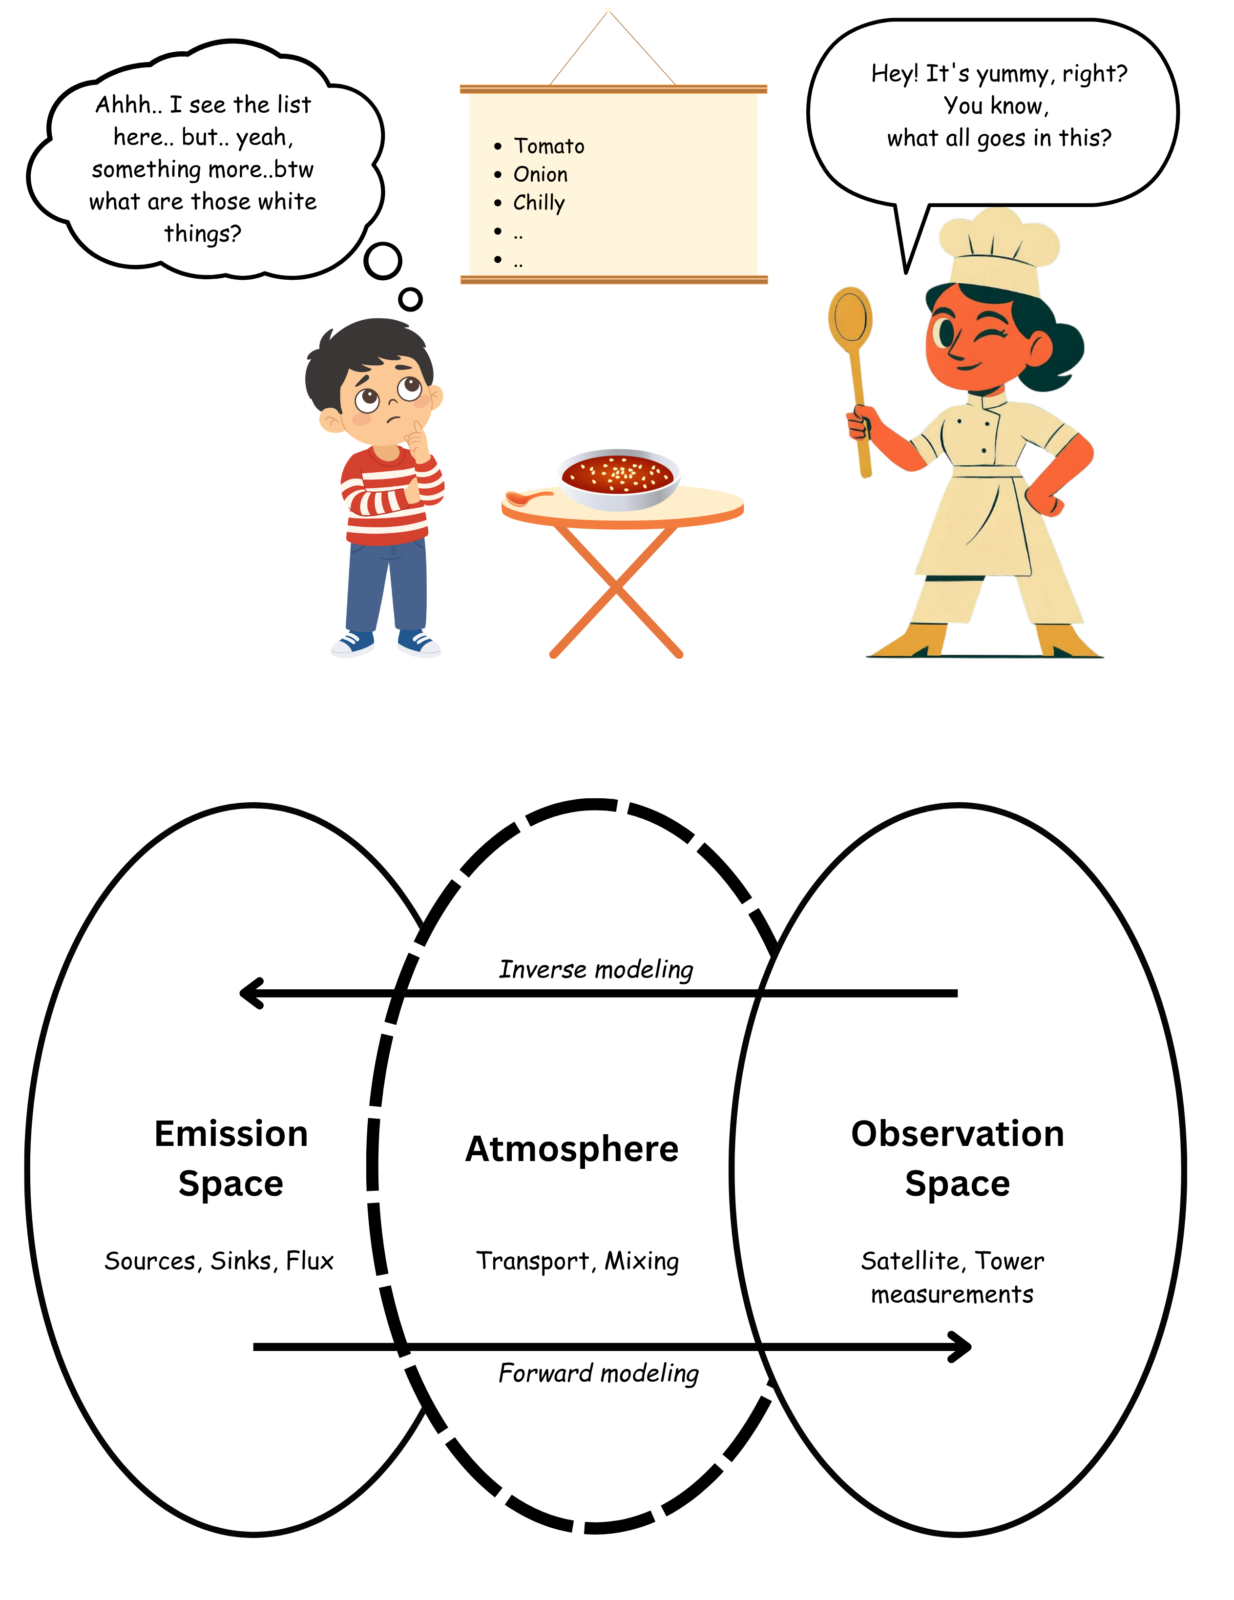
Figure 3. Illustration of the inverse modeling framework.
The central analytical step in our study is Bayesian inversion. Generally, atmospheric modeling works ‘forward’ in atmospheric science and climate applications: if we assume a certain set of emissions, what should the atmosphere look like? Inversion flips that question around. It asks: given what we actually observe in the atmosphere, what emissions must have generated it?
Simply put together, think of it as reconstructing a recipe from a finished dish. You compare the taste against your best initial guess of the ingredients, identify where the simulation falls short, and adjust until the two align. In our case, the “recipe” is the true or optimized emissions, the initial guess of ingredients is the EDGAR global emission inventory, and the “taste” is the TROPOMI observation.
In our study, the Bayesian framework systematically calculates the corrections needed at the level of individual Indian states. Crucially, it also quantifies uncertainty, so rather than a single number, we obtain a range of plausible emissions that is consistent with the observations. While inversion techniques lead to powerful transformations of observational space into parameter space, the resulting solutions can also be challenged by the nature of the observations, which raise issues of existence, uniqueness, and the degree of independence of solutions.
What we found
Our inversion analysis estimated India’s anthropogenic methane emissions at 21.9-24.9 teragrams per year (Tg/year). The confidence in our estimates is within a range of 3.3 Tg/year. Our satellite-inferred methane emission estimate is lower than the values reported for India in global inventories, but is around 19% higher than the emissions reported in India’s Fourth Biennial Update Report. In other words, India appears to emit less methane than global databases claim, but more than the national report suggests. These findings support the argument that global inventories overestimate India’s methane emissions and suggest that national estimates need further refinement. Our study acknowledges some limitations, including sparse ground-based methane observations in India for validation, possible uncertainties in satellite retrievals, and the reliance on certain model assumptions and approximations.
Why this matters for climate policy
The implications of this work go far beyond improving a methane estimate on paper. Climate policy depends on knowing where emissions come from, how they vary across sectors and regions, and where mitigation efforts can have the greatest effect.
If methane emissions are underestimated, important sectors such as livestock, rice cultivation, or waste management may not receive enough policy attention. If it is overestimated in global inventories, that can distort international comparisons and climate negotiations. Better estimates help answer practical questions: which sectors matter most, where emissions are concentrated, and where monitoring or mitigation should be prioritized.
Inaccurate information that fails to capture the complexity of the sources can lead to poorly designed policies, potentially exacerbating the country’s economic burden
Nisbet et al., 2019; Steinebach et al., 2024
Consider agriculture, for instance; agriculture plays an essential role in the Indian economy, ensuring food security. Inadequately devised climate action plans increase risks for farmers who are already vulnerable to climate change, thereby reducing agricultural yields and triggering economic and food crises. Hence, properly devised, better-informed sectoral prioritization for emissions reduction is crucial not only for environmental sustainability and climate change mitigation but also for the country’s economic stability. Beyond regional applications, the techniques demonstrated in this study are highly scalable and adaptable, helping countries worldwide tackle methane emissions with greater confidence and accuracy.
Methane cannot be managed effectively unless it is measured credibly, which must be interpreted with robust scientific tools
Mathew et al., 2026
India urgently needs a stronger methane monitoring network. The current inverse estimates suffer from such precise and accurate measurements from a dense ground-based measurement network. Expanding continuous atmospheric monitoring across India’s diverse regions would improve inversion estimates, strengthen satellite validation, and better capture regional and seasonal patterns. When we get the numbers right, we stand a much better chance of getting the response right. To decode the response, we need innovative technology to leverage credible measurements.
Integrating satellite technology into methane emission estimates across the region via inverse techniques is not merely a scientific advancement; it’s a critical tool for climate action. By such advancements, we are not just investing in technology; we are investing in climate and economic stability, ultimately leading to a future grounded in environmental equity, sustainability, and resilience.
This post is based on the ACP article, Mathew, T. A., Pillai, D., Sukumaran, J., et al. (2026): Leveraging TROPOMI observations and WRF-GHG modeling towards improving methane emission assessments in India.
The research was conducted at the Greenhouse Gas Modeling, Measurements, and Applications (GMA) Laboratory, Indian Institute of Science Education and Research (IISER) Bhopal, India, in collaboration with the Institute of Environmental Physics, University of Bremen, Germany, and the Space Physics Laboratory, Vikram Sarabhai Space Centre (ISRO), India.
Copyright statement
All figures are licensed under Creative Commons Attribution 4.0 International License (CC BY 4.0). Figure 2 uses Natural Earth (public domain) coastline data as a base layer; all rendering, symbology, and annotations are original.