In February 2021, two major Saharan dust events hit Europe. Because of the prevailing weather conditions in the first and last week of February, several million tons of Saharan dust blanketed the skies from the Mediterranean Sea all the way to Scandinavia. The sandy sky was observed almost everywhere in Europe (Fig. 1). Moreover, the stained cars and windows indicated the dust deposition (Fig. 2 – left panel). Environmental agencies also reported low air quality associated with these events (Fig. 2 – right panel). However, the story does not end with the degradation of visibility and air quality. Saharan dust reduced the solar energy generation too!
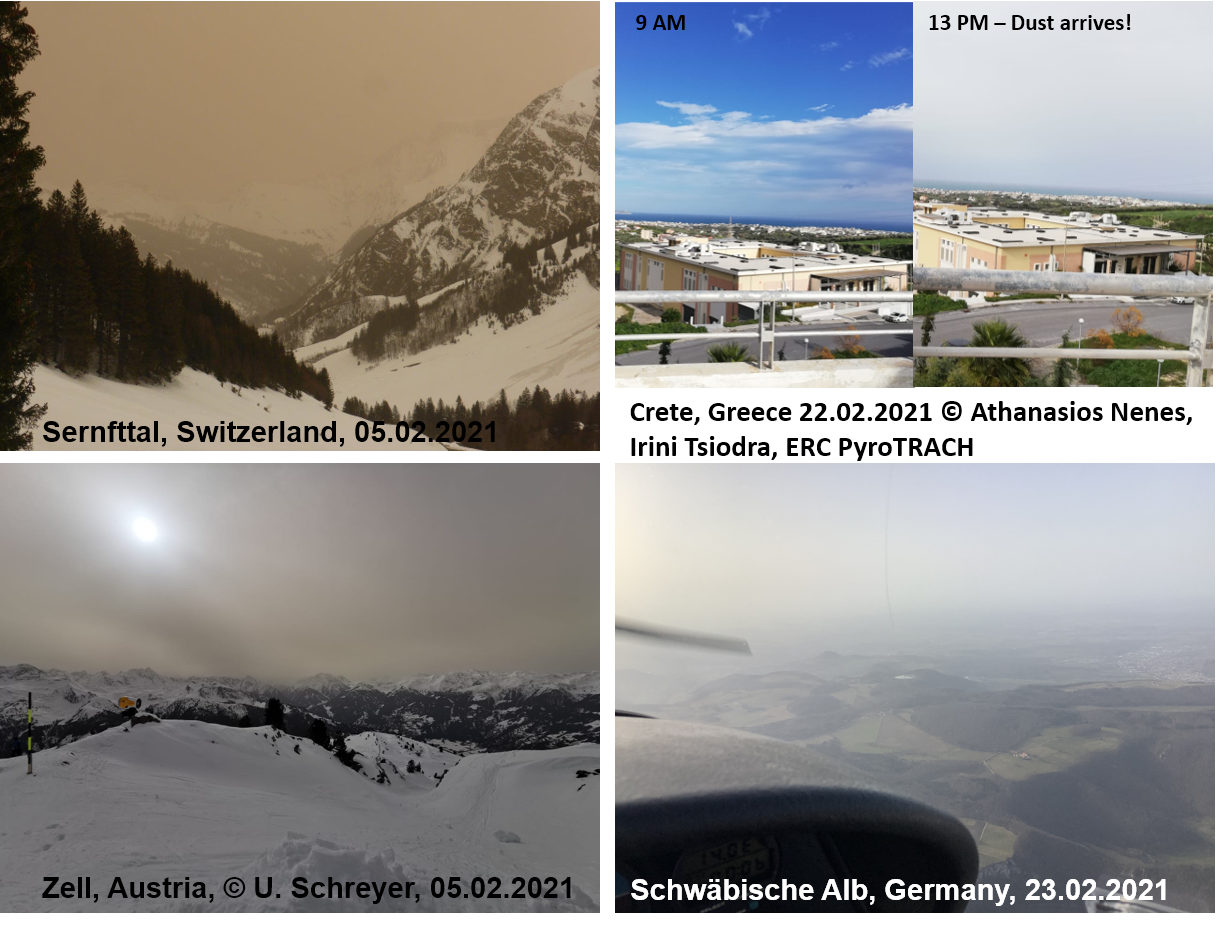
Figure 1: Dusty skies of central Europe in February 2021
The animations of predicted mineral dust optical depth (Fig. 3) show the emission of mineral dust from the northern Sahara (Morocco and Algeria) and the subsequent transport to Europe. These animations are based on the pre-operational mineral dust forecasts performed by German Weather Service (DWD) using the model system ICON-ART, developed at Institute of Meteorology and Climate Research, Karlsruhe Institute of Technology, Germany.
During the first event, weather stations in the Atlas Mountains recorded hurricane-force gusts (e.g. 117 km/h on 05.02.21 in Midelt, Morocco) ahead of a far south reaching low-pressure system in the upper atmosphere and the associated cold front. The high wind speeds close to the surface ultimately led to the release of the dust, which was then transported in a southerly flow toward the Mediterranean Sea. There, a low-pressure system formed and the associated so-called warm conveyor belt lifted the dust to higher altitudes and transported it with the polar jet across the Mediterranean Sea towards the Alps. The dust reached the Alps on 06.02.21. At the observatory at Jungfraujoch, Switzerland a record dust concentration of more than 700 µg m-3 was measured (NABEL (BAFU/Empa)). The daily threshold value for PM10 in Europe is 50 µg m-3 (35 exceedances per year allowed). Furthermore, dust particles are associated with exposure to pathogens and toxic metals that cause adverse impacts on public health. When mixed with air pollution – widespread throughout Europe – the health effects of dust are exacerbated. Subsequent precipitation lead to widespread wet deposition and air quality recovered soon. The deposited dust however can enhance snow and ice melt – and even provide nutrients to the snowpack microbes so the latter can grow and color the snow and ice – which in turn accelerates their melting. The same dust (especially when acidified) can also fertilize oceanic and terrestrial ecosystems and promote photosynthesis globally.
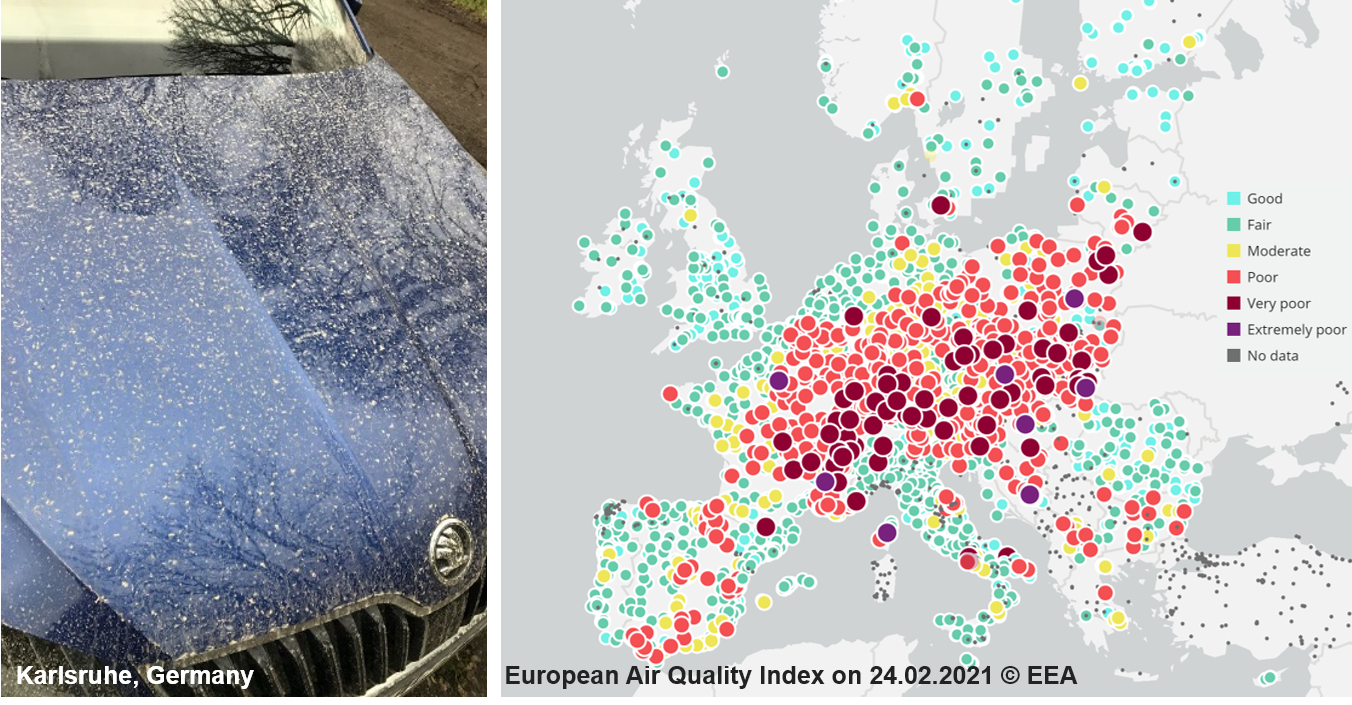
Figure 2: Left: A car stained with dust particles on 06.02.2021; Right: low air quality in large part of Europe on 24.02.2021. The poor to extremely poor air quality is caused by particulate matter. Source: https://airindex.eea.europa.eu
Figure 3: Dust forecast preformed by Deutscher Wetterdienst (DWD) using the model system ICON-ART
During the second event, a similar initial weather situation established with a far southward reaching upper-level trough associated with a large low-pressure complex in the western North Atlantic. The associated trailing cold front caused strong surface winds (83 km/h on 21.02.21 in Midelt, Morocco) and dust uptake in the Northern Sahara of Morocco and Algeria. Southerly flow transported the dust northward into the western Mediterranean where it again entered a warm conveyor belt that effectively lifted the dust and – in a first surge – transported it into the North Sea region and Scandinavia, where precipitation partly led to wet deposition. At the same time, a high-pressure system evolved over Central Europe and became stationary as a so-called “Omega block”. Dust uptake and southward advection towards Europe continued and – in a second surge – was more and more directed into the centre of the “Omega block” where it started to descend into lower levels and the planetary boundary layer over a couple of days. In contrast to the early February event, deposition occurred mostly in dry, clear-sky conditions leading to widespread poor air quality for several days (Fig. 2 – right panel).
What about the impact of the Saharan dust on the solar energy yield? Mineral dust particles not only directly reduce the incoming solar radiation, they also influence cloud formation by promoting ice and droplet formation and also by heating up air masses below or above cloud formation layers. Weather forecast models, that provide the basis for solar energy forecast, ignore all these effects. As a result, the day-ahead predictions significantly overestimated the solar energy yield for e.g. in southwest Germany (up to 50% in early February) (Fig. 4). This deficit translates to several million Euros damage to the renewable energy market.
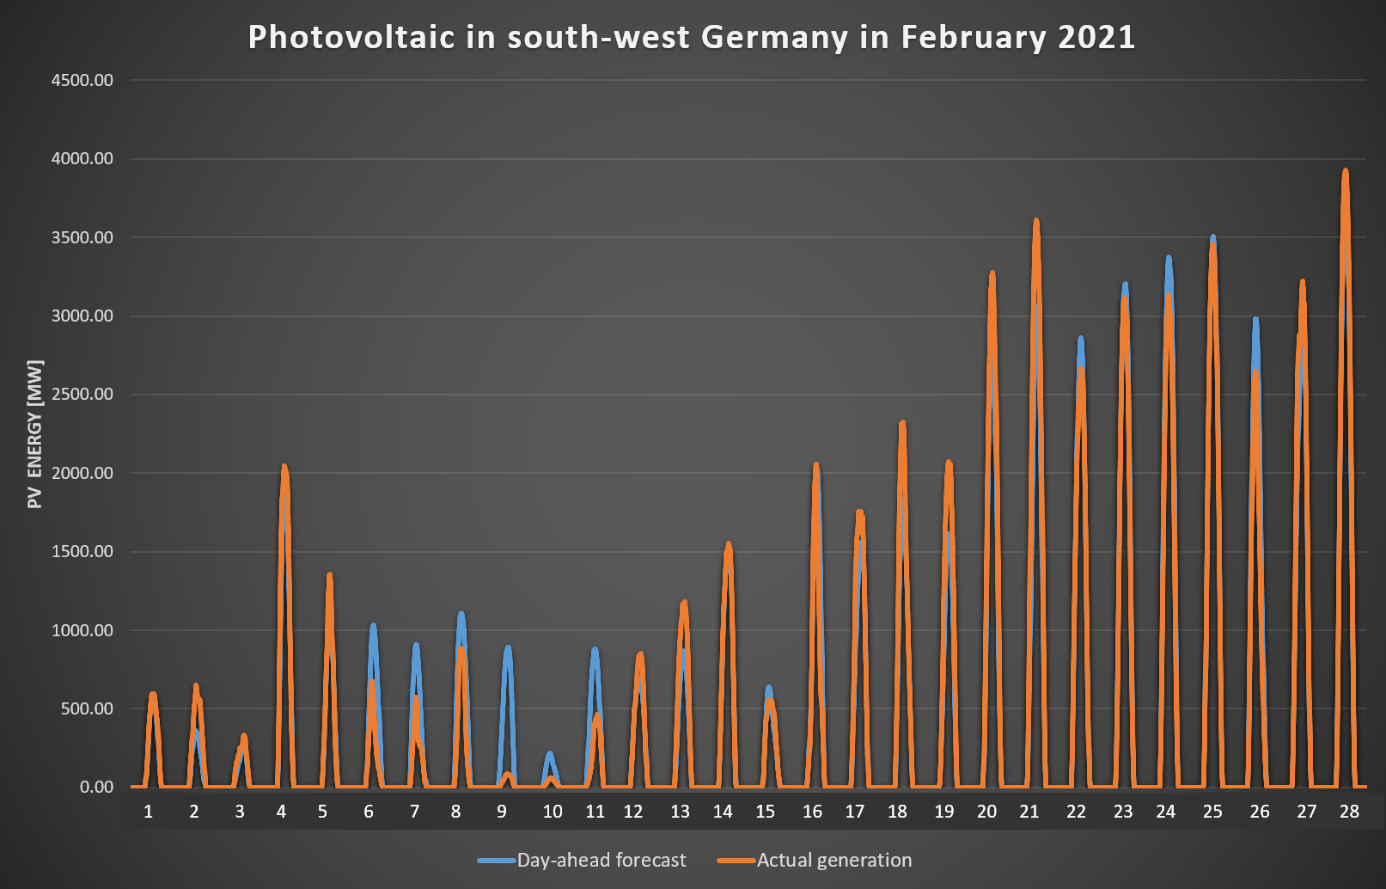
Figure 4: Forecasted (blue) and aggregated (orange) solar energy in SW Germany in Feb. 2021. Dust impacts are visible around 6-10 and 22-26 Feb. Source: https://transparency.entsoe.eu/
A striking feature highlighted in Fig 4 is that the impacts of dust on solar energy generation is much larger during the first event (with mostly cloudy sky) compared to the second one (with mostly clear sky). Does this mean that the dust indirect effects are more important for solar energy forecasts compared to the direct effect? What role does mineral dust play in the formation of ice clouds here? We don’t know yet! These questions and several others are objectives of research projects like PermaStrom. But what we know for sure is that an improved description of dust processes and interactions in operational weather forecasting will improve the solar energy forecast and mitigate the economic damages to the energy market.
Contact person: Ali Hoshyaripour (ali.hoshyaripour@kit.edu)
Author: Ali Hoshyaripour, with contributions by Bernhard Vogel, Heike Vogel, Christian Grams and Julian Quinting, KIT.
Edited by Athanasios Nenes and Mengze Li.

Dr. Ali Hoshyaripour is a senior scientist at Institute of Meteorology and Climate Research, Karlsruhe Institute of Technology, Germany. His primary research interests are atmospheric aerosol modeling and aerosol-cloud-radiation interactions with focus on their impacts on weather, renewable energy, air quality and aviation.
Frank Wagner
Comment on (citation): “At the observatory at Jungfraujoch, Switzerland a record dust concentration of more than 700 µg m-3 was measured (NABEL (BAFU/Empa)). The daily threshold value for PM10 in Europe is 50 µg m-3 (35 exceedances per year allowed).”
The European Commission establishing guidelines for demonstration and subtraction of exceedances attributable to natural sources. Hence an exceedance of the treashold value for PM10 caused by desert dust would not count as an exceedance. However the commission also states that (citation)
“The possibility to subtract natural contributions before comparing the ambient air pollutant concentrations with the limit values does not mean that pollutants of natural origin are not adversely affecting health.”
For details see: https://ec.europa.eu/environment/air/quality/legislation/pdf/sec_2011_0208.pdf