Miniature ocean at the Coriolis facility in Grenoble. [Credit: Mirjam Glessner]
To study how the ocean behaves in the glacial fjords of Antarctica and Greenland, we normally have to go there on big icebreaker campaigns. Or we rely on modelling results, especially so to determine what happens when the wind or ocean properties change. But there is also a third option that we tend to forget about: we can recreate the ocean in a lab. This is exactly what our Bergen-Gothenburg team has been doing these last weeks at the Coriolis facility, in sunny Grenoble.
How to build your own miniature ocean
Take a 13m diameter (circular) swimming pool. Install it on a rotating platform, and start turning to simulate the Coriolis force, i.e. the impact of the Earth rotation on the flow. Fill it so that the water level reaches 90cm. Actually, the exact value does not matter and can be changed; just make sure that your tank width is an order of magnitude larger than your depth, and that you do not overflow everywhere on the lab floor. Congratulations, you have an ocean! But for now it is a bit boring.
Let’s add some stratification and density-driven currents. As we explained in a previous entry, all you need to do for that is change the temperature and/or salinity of your water. The people here at the Coriolis facility say that changing the salinity is easier than the temperature, so ok, put a source somewhere in your tank that will spit out salty water. Make it even more realistic: have some trough, underwater mountains, solid ice shelves etc. Or rather, some Plexiglas of the corresponding shape. Now you have a beautiful part of the ocean with realistic currents!
But how do you observe it? You can lower probes into the water at specific locations, as if you were doing miniature CTD casts in your miniature ocean. Or you can visualise the whole full-depth flow: add tracer particles to the water flowing from the source (in our case, biodegradable plastic), shoot lasers at it at various depth levels, and take high resolution pictures as you do so. Then, you can track the particles from one image to the next to infer their velocity, using a method called PIV.
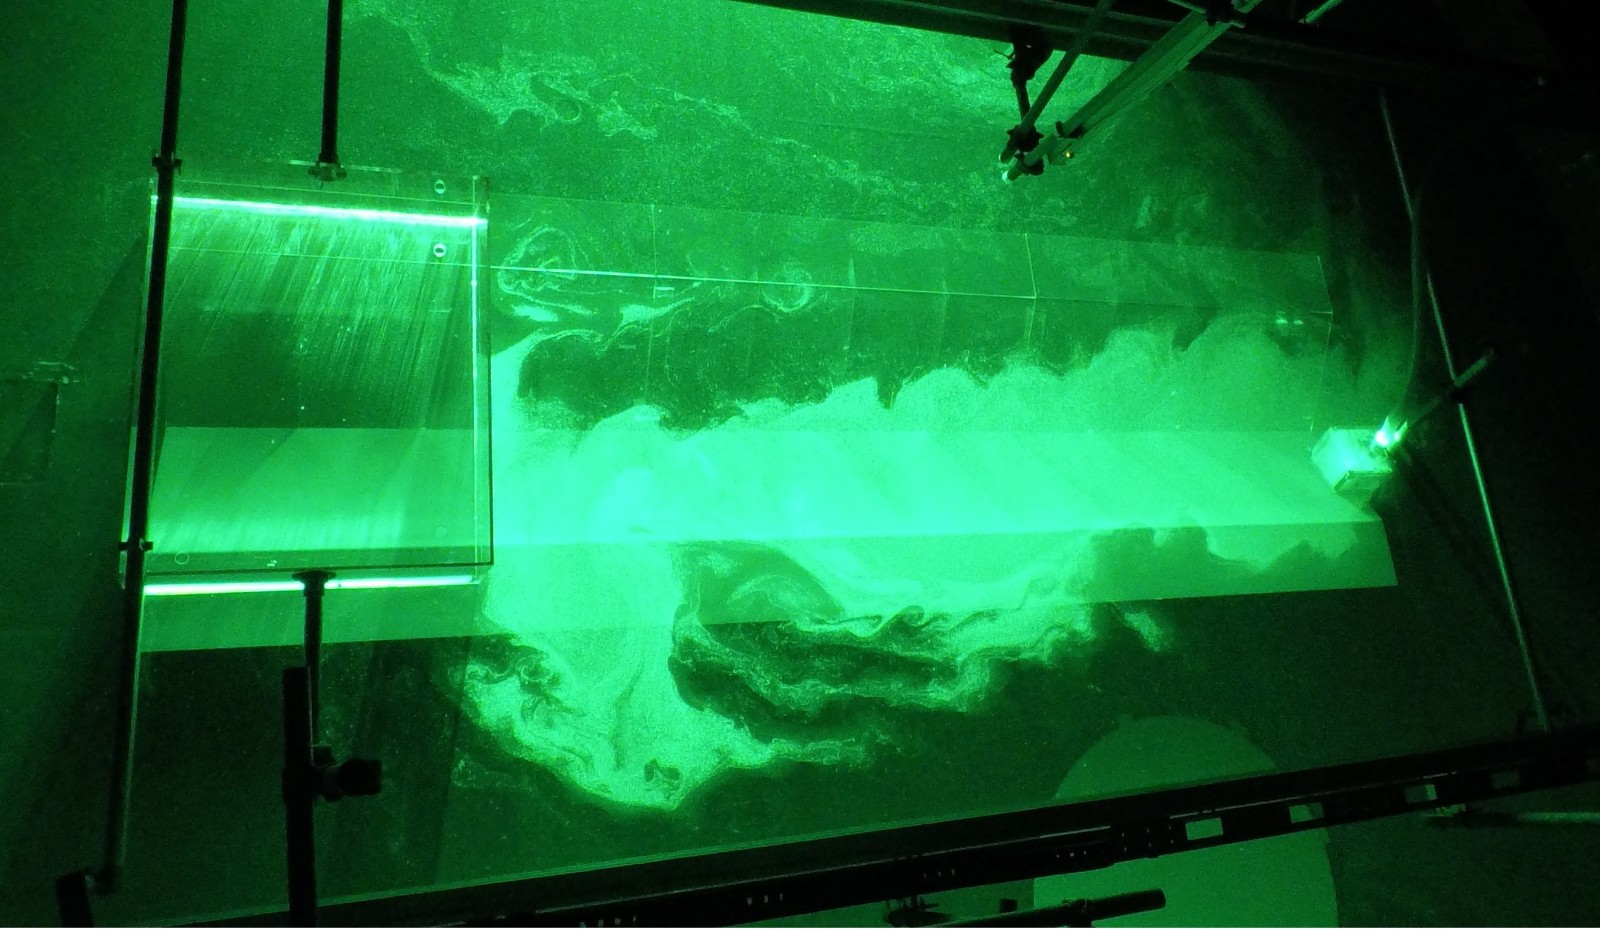
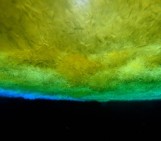
By the way, it looks way neater than on this image – that one is just from our overview camera, for fun. [Credit: Céline Heuzé]
What does it look like when you fire lasers at a large rotating tank?
In a nutshell, it looks like this:
The water flows from the source on the right of the image, towards the ‘ice shelf’ on the left. We are watching the scene from above, from our office that rotates with the tank. The laser successively illuminates several levels from the bottom of the channel to the water surface, revealing the changing structure of the flow with depth. In our real experiment, it took more than 10 minutes for the water to reach the ‘ice shelf’ – here, I have slightly accelerated it.
It is surprisingly peaceful and relaxing to watch. Well, there is tension and suspense regarding what the flow will do since this is, after all, why we are here. But otherwise you are in the dark, with particles shining all around you, in the silence except for the low-squeeking noise of the rotating tank, gently rocked by the vibrations of the platform, and there is not much you can do but wait and enjoy the view. You can also count how many undesired bubbles and dead insects floating at the surface you can see!
Why do we need rotating tank experiments?
As we explained in this blog, the future of the Antarctic ice sheet is unknown due to marine ice sheet instability. We do not know under which conditions the floating ice shelves that block (‘buttress’) the big land-based ice sheet may collapse. In particular, we do not know what controls the flow of comparatively warm waters that melt the ice shelves:
- under which conditions do these waters penetrate under the ice?
- at which depths do they sit?
- what are the impacts of stratification and the shape of the ice shelf itself?
These questions cannot easily be answered by going in the field. We would need access to many ice shelves, year round, and the ability to observe the flow everywhere –including under the ice– synoptically. Instead in the lab, we just need to adjust our flow speed, or the rotation speed of the tank, or the amount of salt in the source, and we are ready to observe!
Further reading:
The blog of the team: https://skolelab.uib.no/blogg/darelius/
Our blog post about the video game Ice Flows!, illustrating the marine ice sheet instability
Edited by Sophie Berger