Post by Elco Luijendijk, Junior lecturer in the Department of Structural Geology and Geodynamics at Georg-August-Universität Göttingen and WaterUnderground founder Tom Gleeson (@water_undergrnd), Associate Professor in the Department of Civil Engineering at the University of Victoria.
Most of the groundwater on our planet is located in sedimentary rocks. This is why it is important to know how easy or hard it is for water to flow through pores in sediments, which is governed by permeability. Unfortunately, permeability is extremely variable. Wouldn’t it be great if we could estimate permeability based on sediment types (for which a decent amount of data exist)?
Enter the 150+ year challenge to estimate the permeability of sediments with universal equations. Most of the equations work well for one sediment type, such as pure sands or clay. For instance, the Kozeny-Carman equation from the 1920s tends to work well for most granular materials such as sand or silt. However, pure sands or clays are rare, and most of what’s out there are mixtures.
Evaluating how well existing and new equations work for mixed sediments is tricky business. Searching high and wide only three datasets with 78 samples were found that contained all the required information (grain size distribution, clay mineralogy). Needless to say, more data are needed to improve the predictive equations. In a paper published a few years ago we found that in most cases, the permeability of the sediments could be estimated in a two-step process:
- calculate the permeability of clay and granular (sand/silt) components, and
- calculate the permeability of the mixed sediment by taking the geometric mean of the two components weighed by the clay content of the sediment.
The resulting workflow was published as a series of equations that are not particularly easy to work with. That is why we recently decided to take advantage of the general awesomeness of Jupyter notebooks to publish a do-it-yourself notebook to calculate permeability on GitHub (https://github.com/ElcoLuijendijk/permeability_notebooks). For those of you new to Jupyter notebooks: these are documents that contain a readable mix of text, code, data and figures and can be used to publish studies in such a way that you can reproduce the analysis and make the figures yourself (much like R Markdown).
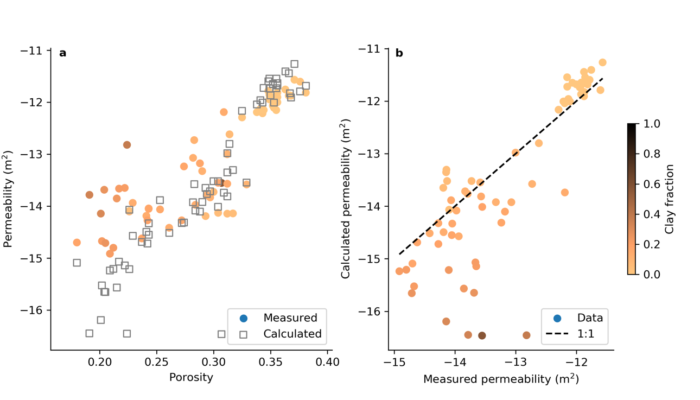
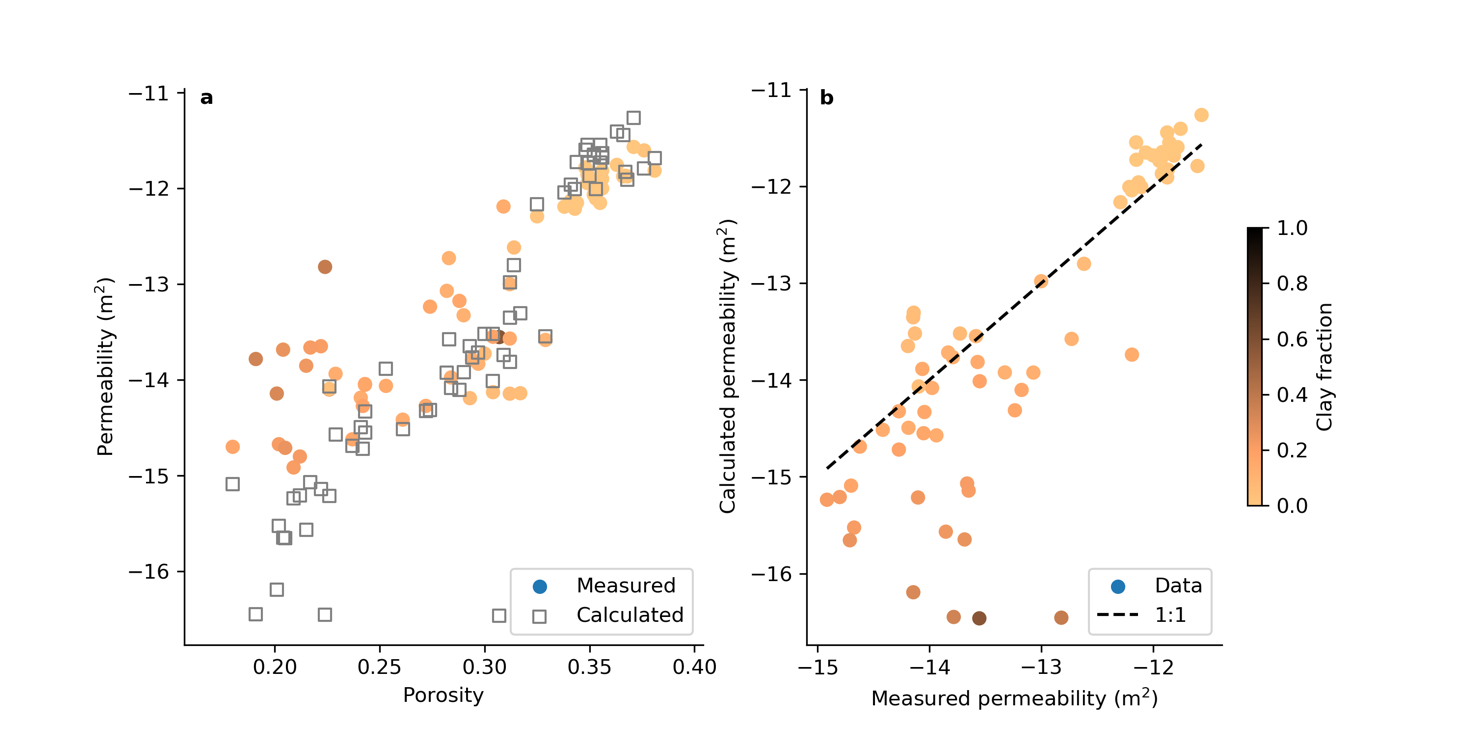
The Jupyter notebooks to calculate permeability consist of a main notebook and additional notebooks to calculate the specific surface area of sediments. Also included are all the calibration datasets Jthat were compiled for the publication. You can use the data to evaluate how well the permeability equations match these datasets, or you can set up a new spreadsheet with data from your own study area which can then be used by the notebook to calculate permeability. The notebook automatically generates several figures like the one below (Figure 1).
There is also an additional notebook that calculates first-order estimates of permeability from well log data collected by geophysical tools that map the density or water content of sediments. Such well log data can be more widely available than detailed sediment records and may help estimate permeability for the deeper subsurface (>100s of m), where permeability data are generally scarcer than at the surface.
Comparing these datasets and equations with the Jupyter notebooks highlight the gaps in quantifying permeability. These notebooks and datasets are out there for the world, so join the effort to make more accurate predictions of permeability (and groundwater flow) in sediments!

Figure 1: Figure produced by the Jupyter notebook showing measured vs calculated permeability using an example dataset of mixed natural sediments.


