Post by Anne van Loon, University of Birmingham
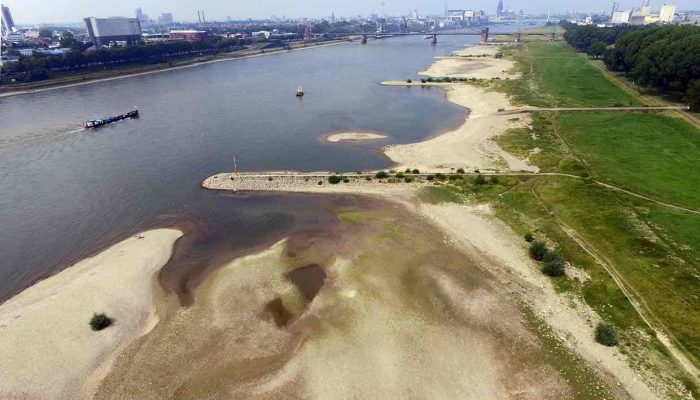
You might remember that the summer of 2015 was extremely dry in large parts of Europe (Figure 1), leading to crop losses, wildfires, drinking water supply deficiencies, and reductions in energy production and navigation (Van Lanen et al., 2016), whether you experienced it yourself or read about it in the newspapers. Based on incomplete information the European Environment Agency already estimates the total economic losses of the event at more than 2 billion Euros (http://www.eea.europa.eu/data-and-maps/indicators/direct-losses-from-weather-disasters-3/assessment).
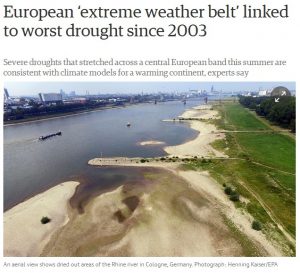
Figure 1: Media coverage of the 2015 drought in Europe (source: The Guardian)
Seventy-five percent of EU inhabitants depend on groundwater for their water supply, which makes groundwater management extremely important. To manage groundwater effectively during drought periods like 2015, data about groundwater levels are needed in (near-) real time. However, observations of groundwater levels are rarely available in real time, even in Europe, one of the most densely monitored areas of the world.
In a just published paper, we therefore tested two methods to estimate groundwater drought in near-real time (Van Loon et al., 2017). The first method is based on satellite data from the GRACE satellites (Gravity Recovery and Climate Experiment, grace.jpl.nasa.gov), a cool new pair of satellites that measure the Earth’s gravitational field to estimate changes in the amount of water on Earth. Previous research had suggested that the Total Water Storage (TWS) anomalies derived from GRACE could represent hydrological drought (e.g. Thomas et al., 2014). With models the TWS anomalies can be decomposed into their compartments, including groundwater storage. The second method uses a statistical relationship between rainfall and historic groundwater levels, which depends on aquifer properties and has previously been used to study past drought events (e.g. Bloomfield and Marchant, 2013).
To test both methods we looked at the benchmark 2003 drought for two regions in southern Germany and eastern Netherlands. First, we used observed groundwater level data from 2040 monitoring wells to calculate the Standardized Groundwater Index (SGI), which ranges from 0 (abnormally dry) to 1 (abnormally wet) (Figure 2a). Interestingly, the SGI reveals the patchiness of the 2003 groundwater drought caused by differences in aquifer characteristics. Quickly responding aquifer systems experienced drought in response to low rainfall in previous months and slowly responding aquifer systems experienced wetness in response to high rainfall in the preceding year (you might be aware of the 2002 summer floods in the same region). GRACE TWS showed dry anomalies in Germany and (to a lesser extent) in the Netherlands (Figure 2b), but the coarse resolution of GRACE prevents it from picking up the high spatial variability in groundwater levels we saw in the observations (Figure 2a). The groundwater storage derived from GRACE TWS by subtracting surface and soil storage gave abnormally wet conditions in most parts of the study regions (Figure 2c), with drier than normal values only in the eastern part of Germany which in the observations was mostly wetter than normal (Figure 2a). Finally, we calculated a form of the SGI based on the response of groundwater to precipitation (Figure 2d). The spatial pattern of this precipitation-based SGI closely resembles the observed SGI (Figure 2a), although it slightly overestimates the severity of the groundwater drought in Germany.
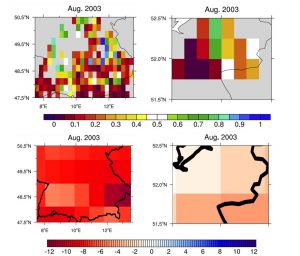
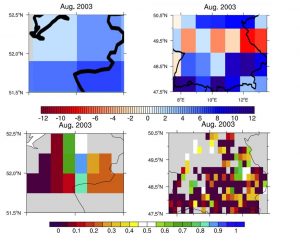
Figure 2: The 2003 groundwater drought in southern Germany and eastern Netherlands, derived from a) observed groundwater levels (standardised groundwater index, SGI), b) GRACE Total Water Storage (anomalies with regard to the long-term average), c) groundwater anomalies based on GRACE and model outputs (anomalies with regard to the long-term average), and d) observed precipitation and the relationship between precipitation and groundwater levels based on historic data (standardised groundwater index, SGI). Adapted from Van Loon et al. (2017).
We then used the precipitation-based SGI to estimate the 2015 groundwater drought in the same regions (Figure 3). This showed a completely different picture than the 2003 drought. Almost the whole region of southern Germany experienced an extreme drought, whereas the Netherlands was quite wet in August 2015. No patchiness in groundwater levels was observed in 2015, because both short- and long-term rainfall were below average. This means that the 2015 drought was more severe in terms of water resources for drinking water and irrigation because all groundwater wells had low levels, compared to about two thirds in 2003.
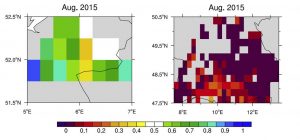
Figure 3: The 2015 groundwater drought in southern Germany and eastern Netherlands, derived from observed precipitation and the relationship between precipitation and groundwater levels based on historic data (standardised groundwater index, SGI). Adapted from Van Loon et al. (2017).
Based on our analysis, we think that using readily available rainfall data and the historic relationship between rainfall and groundwater is a cunning way to monitor groundwater drought at a high enough resolution for water management. However, this technique still has more uncertainties than using real-time groundwater observations directly. To prevent issues with drinking water supply for the EU’s 380 million people that depend on groundwater, there is a clear need to measure groundwater levels and make them freely available in real-time.
The scientific paper on which this blog is based can be found here (http://www.hydrol-earth-syst-sci.net/21/1947/2017/).
References
Bloomfield, J. P. and Marchant, B. P. (2013) Analysis of groundwater drought building on the standardised precipitation index approach, Hydrology and Earth System Sciences, 17, 4769–4787, doi: 10.5194/hess-17-4769-2013.
Thomas, A. C., Reager, J. T., Famiglietti, J. S., and Rodell, M. (2014) A GRACE-based water storage deficit approach for hydrological drought characterization, Geophysical Research Letters, 41, 1537–1545, doi: 10.1002/2014GL059323.
Van Lanen, H. A. et al (2016) Hydrology needed to manage droughts: the 2015 European case. Hydrological Processes, 30: 3097–3104. doi: 10.1002/hyp.10838.
Van Loon, A. F., Kumar, R., and Mishra, V. (2017) Testing the use of standardised indices and GRACE satellite data to estimate the European 2015 groundwater drought in near-real time, Hydrology and Earth System Sciences, 21, 1–25, doi: 10.5194/hess-21-1-2017.