Wellcome Library, London
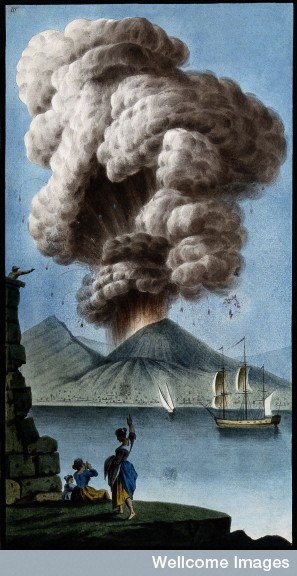
A small eruption of Mount Vesuvius on 8 August 1779, part of a sequence that culminated in a moderate eruption. Coloured etching by Pietro Fabris, 1779. Copyrighted work available under Creative Commons Attribution only licence CC BY 2.0
A new paper in Nature Geoscience by Santer and colleagues revisits the volcanic scenarios used in modern climate model simulations. The authors consider the effects of including a ‘more realistic’ model for the influence of small volcanic eruptions on the climate system over the past two decades. Of course, more realistic means more difficult.. and one of the long-standing and unresolved problems with small volcanic eruptions is that not only are they small, but their consequences are unpredictable. These complications arise, in part, from the fact that the part of the volcanic system that is responsible for the climate impact are the emitted gases (notably, sulphur dioxide or SO2), and not the volcanic ash. In real volcanoes, these two parameters don’t seem to be very well correlated – and it has been well known for some time that small but explosive eruptions of sulphur-rich magmas might well have a disproportionate effect on the climate system (see, for example, Rampino and Self, 1984; Miles et al., 2004). For this reason, models of volcano-climate impact that only use information on eruption size (as measured by the Volcanic Explosivity Index) will usually only be a poor approximation to reality. A better representation might instead be a volcanic sulphur dioxide climatology, building on the extensive work of the volcanic emissions satellite-remote sensing community since the first volcanic plume satellite measurements in 1979. The currently most up to date compilations of volcanic SO2 emissions since 1996 can be found in Carn et al., (2003) and McCormick et al., (2013).
Reading between the lines, it looks as though Santer and colleagues have come to a similar conclusion – finding that their model simulations get a little closer to observations of tropospheric temperature trends when they introduce a ‘realistic’ volcanic scenario to simulate the past 25 years of eruptions. What a pity that the volcanic dataset they relied on to line up particular eruptions with aerosol optical depth perturbations was patched together from secondary sources. Clearly, as they suggest, more work is needed – but why not start by bringing the climate modeling community and volcanologists together to find out what we each think that we know ?
Further reading.
Carn SA et al. 2003 Volcanic eruption detection by the Total Ozone Mapping Spectrometer (TOMS) instruments: a 22-year record of sulphur dioxide and ash emissions, In: Oppenheimer et al. (eds), Volcanic Degassing, Geological Society, London, Special Publications 213, 177-202.
McCormick BT et al. 2013 Volcano monitoring applications of the Ozone Monitoring Instrument, In: Pyle DM et al. (eds), Remote Sensing of Volcanoes and Volcanic Processes, Geological Society, London, Special Publications 280, 1259-291.
Miles GM, Grainger RG and Highwood EJ 2004 The significance of volcanic eruption strength and frequency for climate Q. J. R. Met. Soc. 130 2361–76
Pyle DM 2012 Small volcanic eruptions and the stratospheric sulfate aerosol burden Environ. Res. Lett. 7 031001
Rampino MR and Self S 1984 Sulphur-rich volcanic eruptions and stratospheric aerosols, Nature 310, 677 – 679
Santer B et al, 2014, Volcanic contribution to decadal changes in tropospheric temperature Nature Geoscience (2014) doi:10.1038/ngeo2098
Related posts.
For more information on William Hamilton and Vesuvius, try this delightful blog post by Karen Meyer-Roux.

Benjamin Santer
Dear Professor Pyle,
In your blog post, you write: “What a pity that the volcanic database they used in their analysis was just cobbled together from secondary sources”. This implies – incorrectly – that our statistical analysis of volcanic effects on ‘ENSO removed’ lower tropospheric temperature (and on net clear-sky SW fluxes at the top of the atmosphere) relied on information “cobbled together from secondary sources”. Our statistical analysis relied on satellite-based estimates of monthly-mean changes in stratospheric aerosol optical depth (SAOD), updated from Vernier et al. (2011). These occultation-based measurements of SAOD changes are not “secondary sources” of information.
As you correctly pointed out earlier, our Supplementary Table did not list all post-2000 eruptions with VEI greater than or equal to 3. Our Table merely lists the eruptions given in Vernier et al. (2011) and in Neely et al. (2013). The fact that Supplementary Table 4 does not provide a comprehensive list of all post-2000 eruptions with VEI greater than or equal to 3 is irrelevant for our assessment of the statistical significance of volcanic cooling signals. The SAOD effects of eruptions not listed in Supplementary Table 4 are presumably represented in the Vernier et al. dataset.
With best regards,
Ben
davidmpyle
Thanks Ben – I have amended the post to make it clear that my colourful language was referring to the tabulated eruption list in the supplementary data. I have also added in new links to papers by Carn et al (2003) and McCormick et al (2013) that together provide a compilation of major volcanic SO2 emissions since 1996.
David.